8. Quick Start Guide
This Quick Start Guide serves as a fast, hands-on introduction to L7|ESP and will walk you through performing common L7|ESP activities. Specifically, this Quick Start Guide will teach you how to:
Navigate L7|ESP's user-friendly user interface (UI).
Create a simple Protocol that tracks values associated with Entities.
Create a simple Pipeline that generates a Report after each Entity is processed.
Create a Workflow that allows the Protocol and Pipeline to be used together to process Entities.
Create a Project for managing Experiments.
Register Entities and then use the registered Entities in an Experiment based on the Workflow.
Update the Workflow to learn about versioning, data linking, and L7|ESP Expressions.
8.1. Login
Open the URL provided by your Admin in any web browser. Log in using the credentials provided by your Admin.
Hint
If you are a new user and this is your first time logging in, it is recommended that you immediately reset your original password for security purposes.
8.2. Create Standard Protocol
In this section you will create a Standard Protocol to collect 260:280 ratios for nucleic acid Entities. This Standard Protocol will later be used when creating a Workflow.
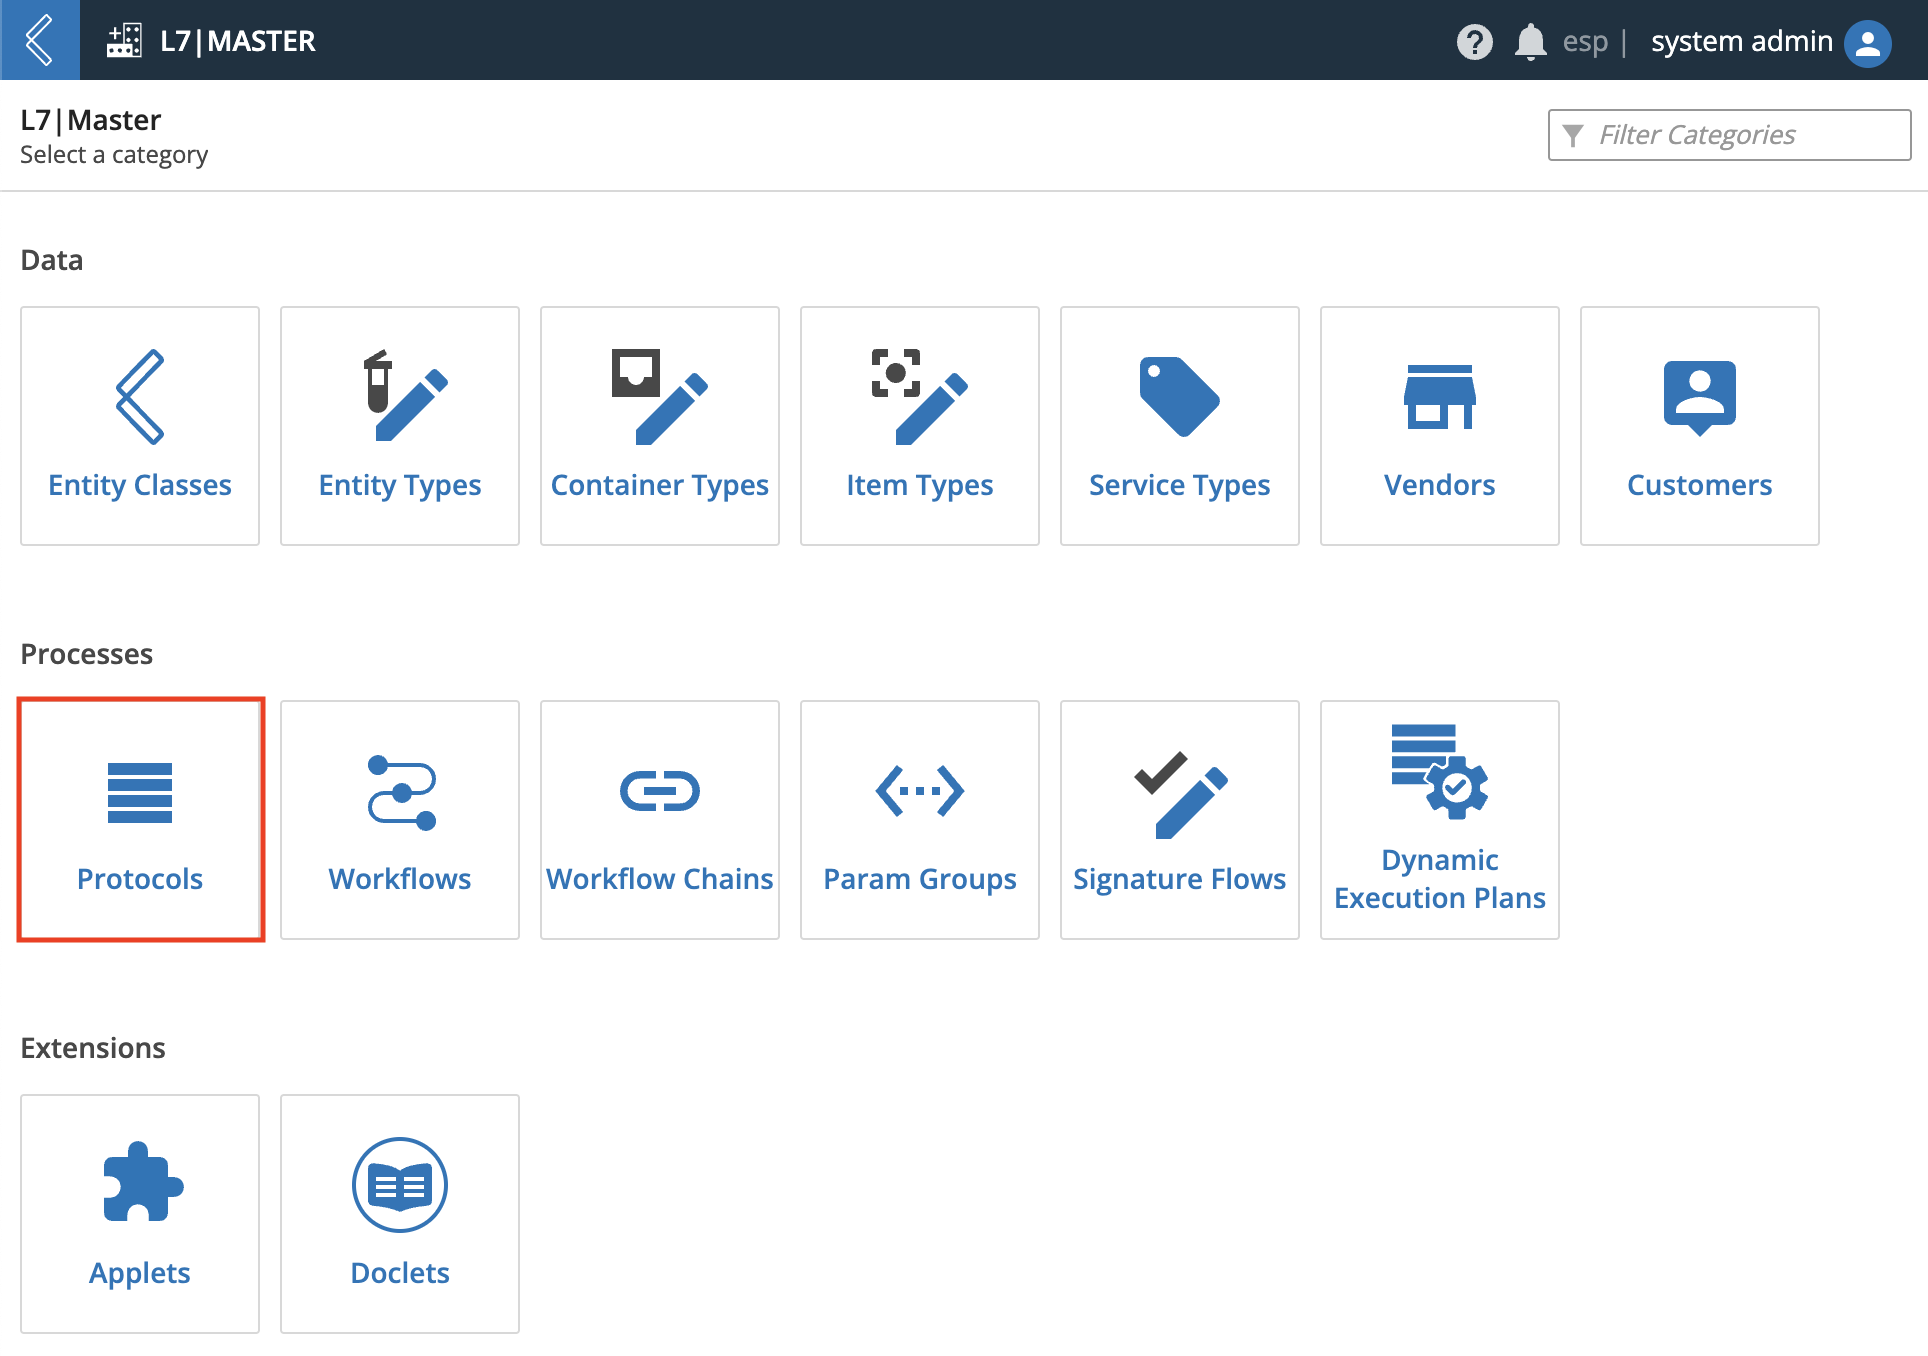
Click the L7|Master app. Click Protocols from the Processes menu to access the Protocols page.
Click + New Protocol.

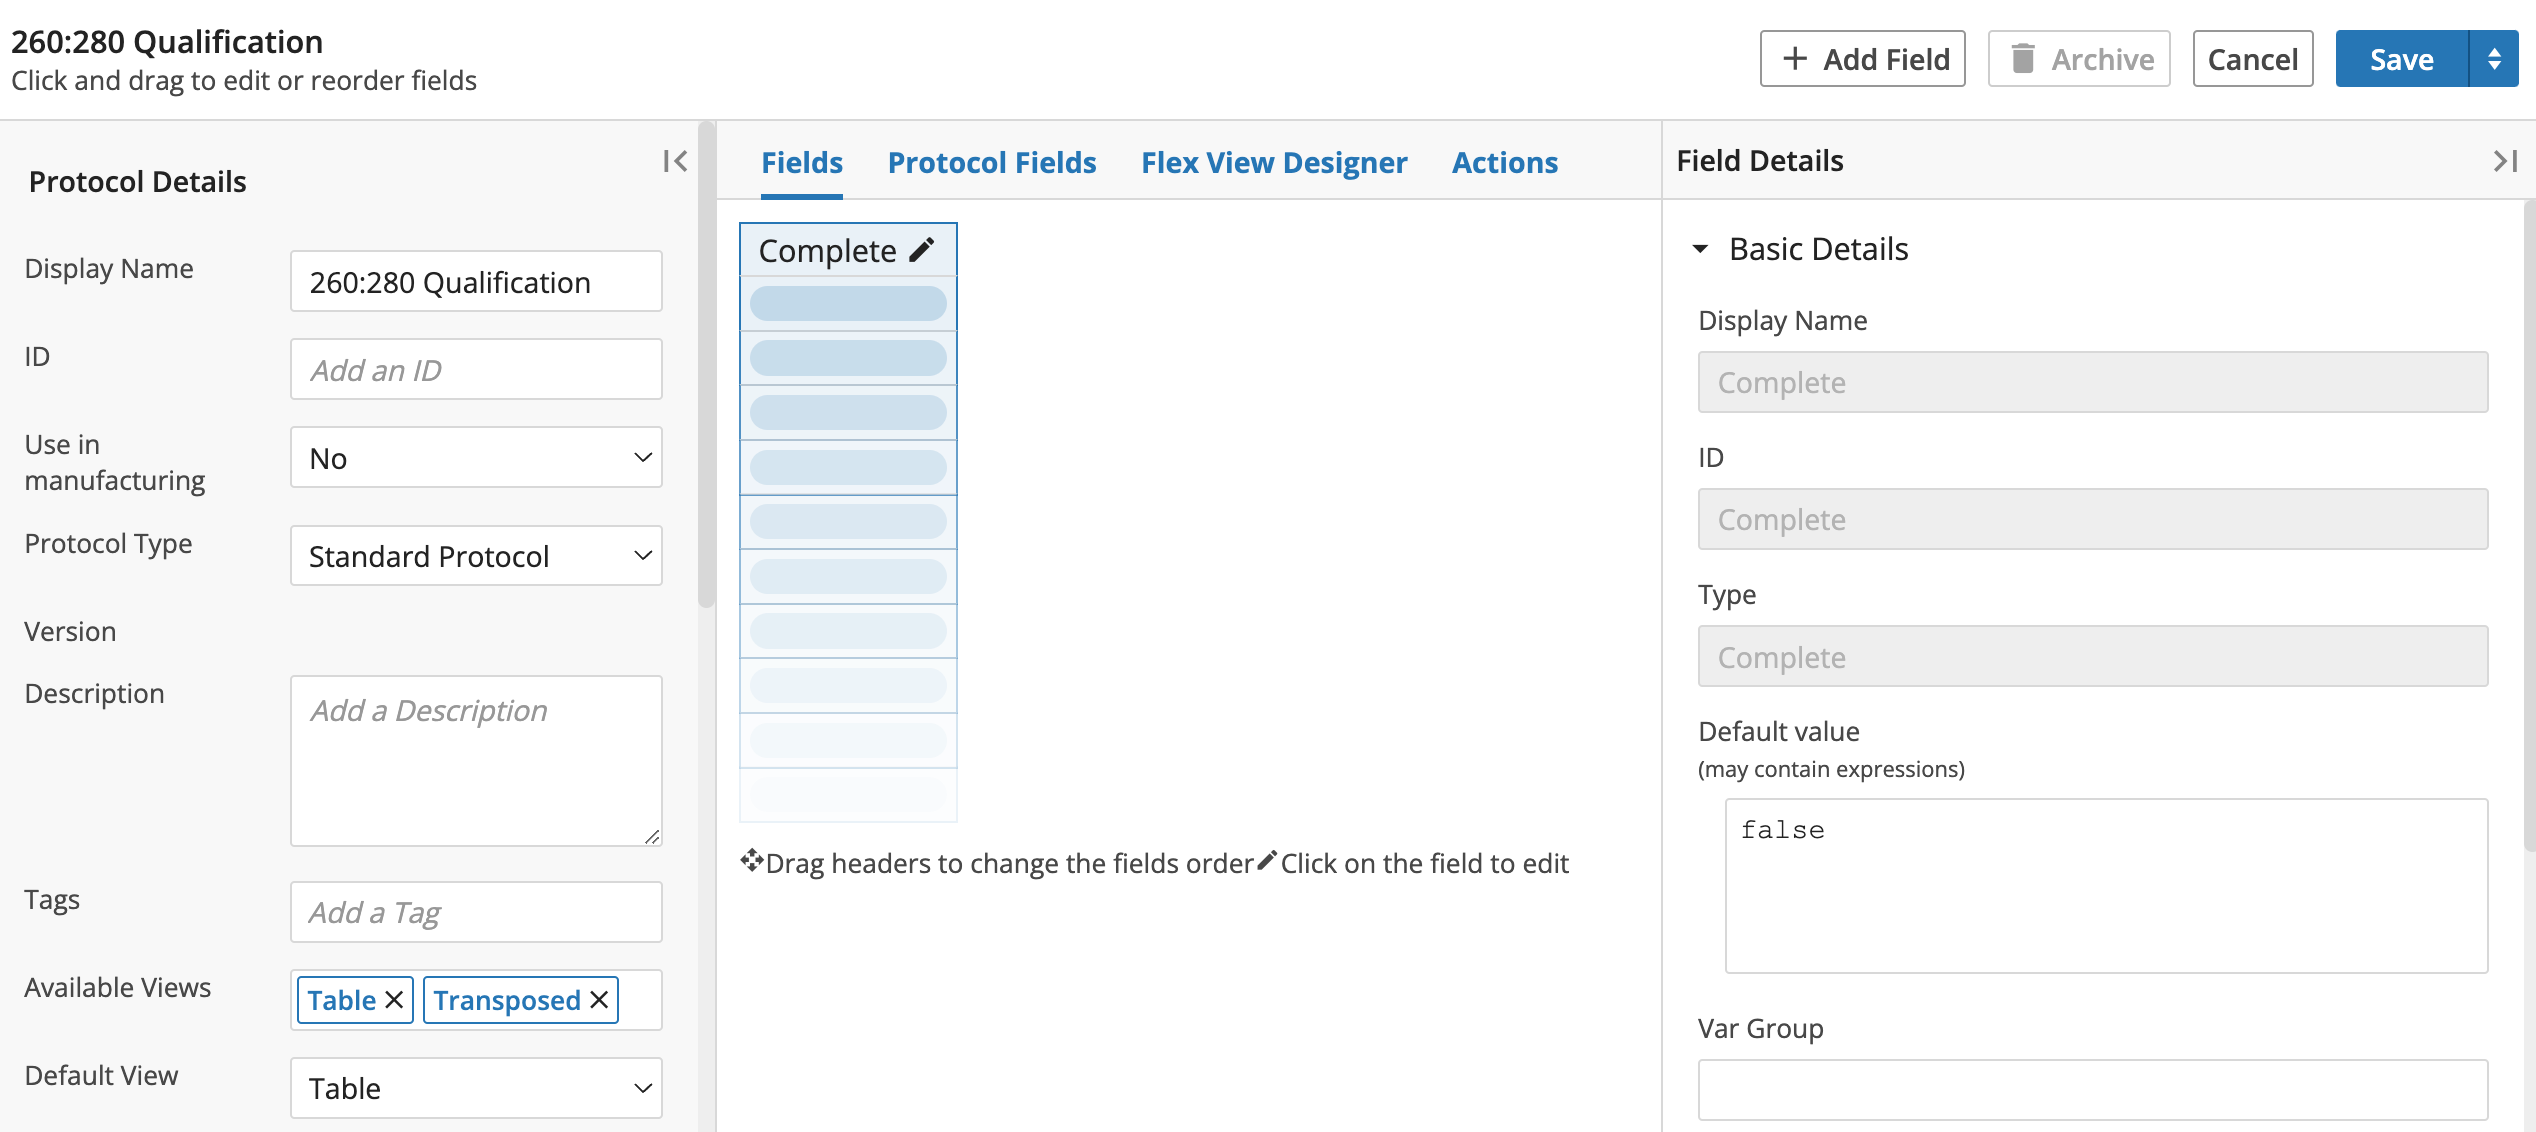
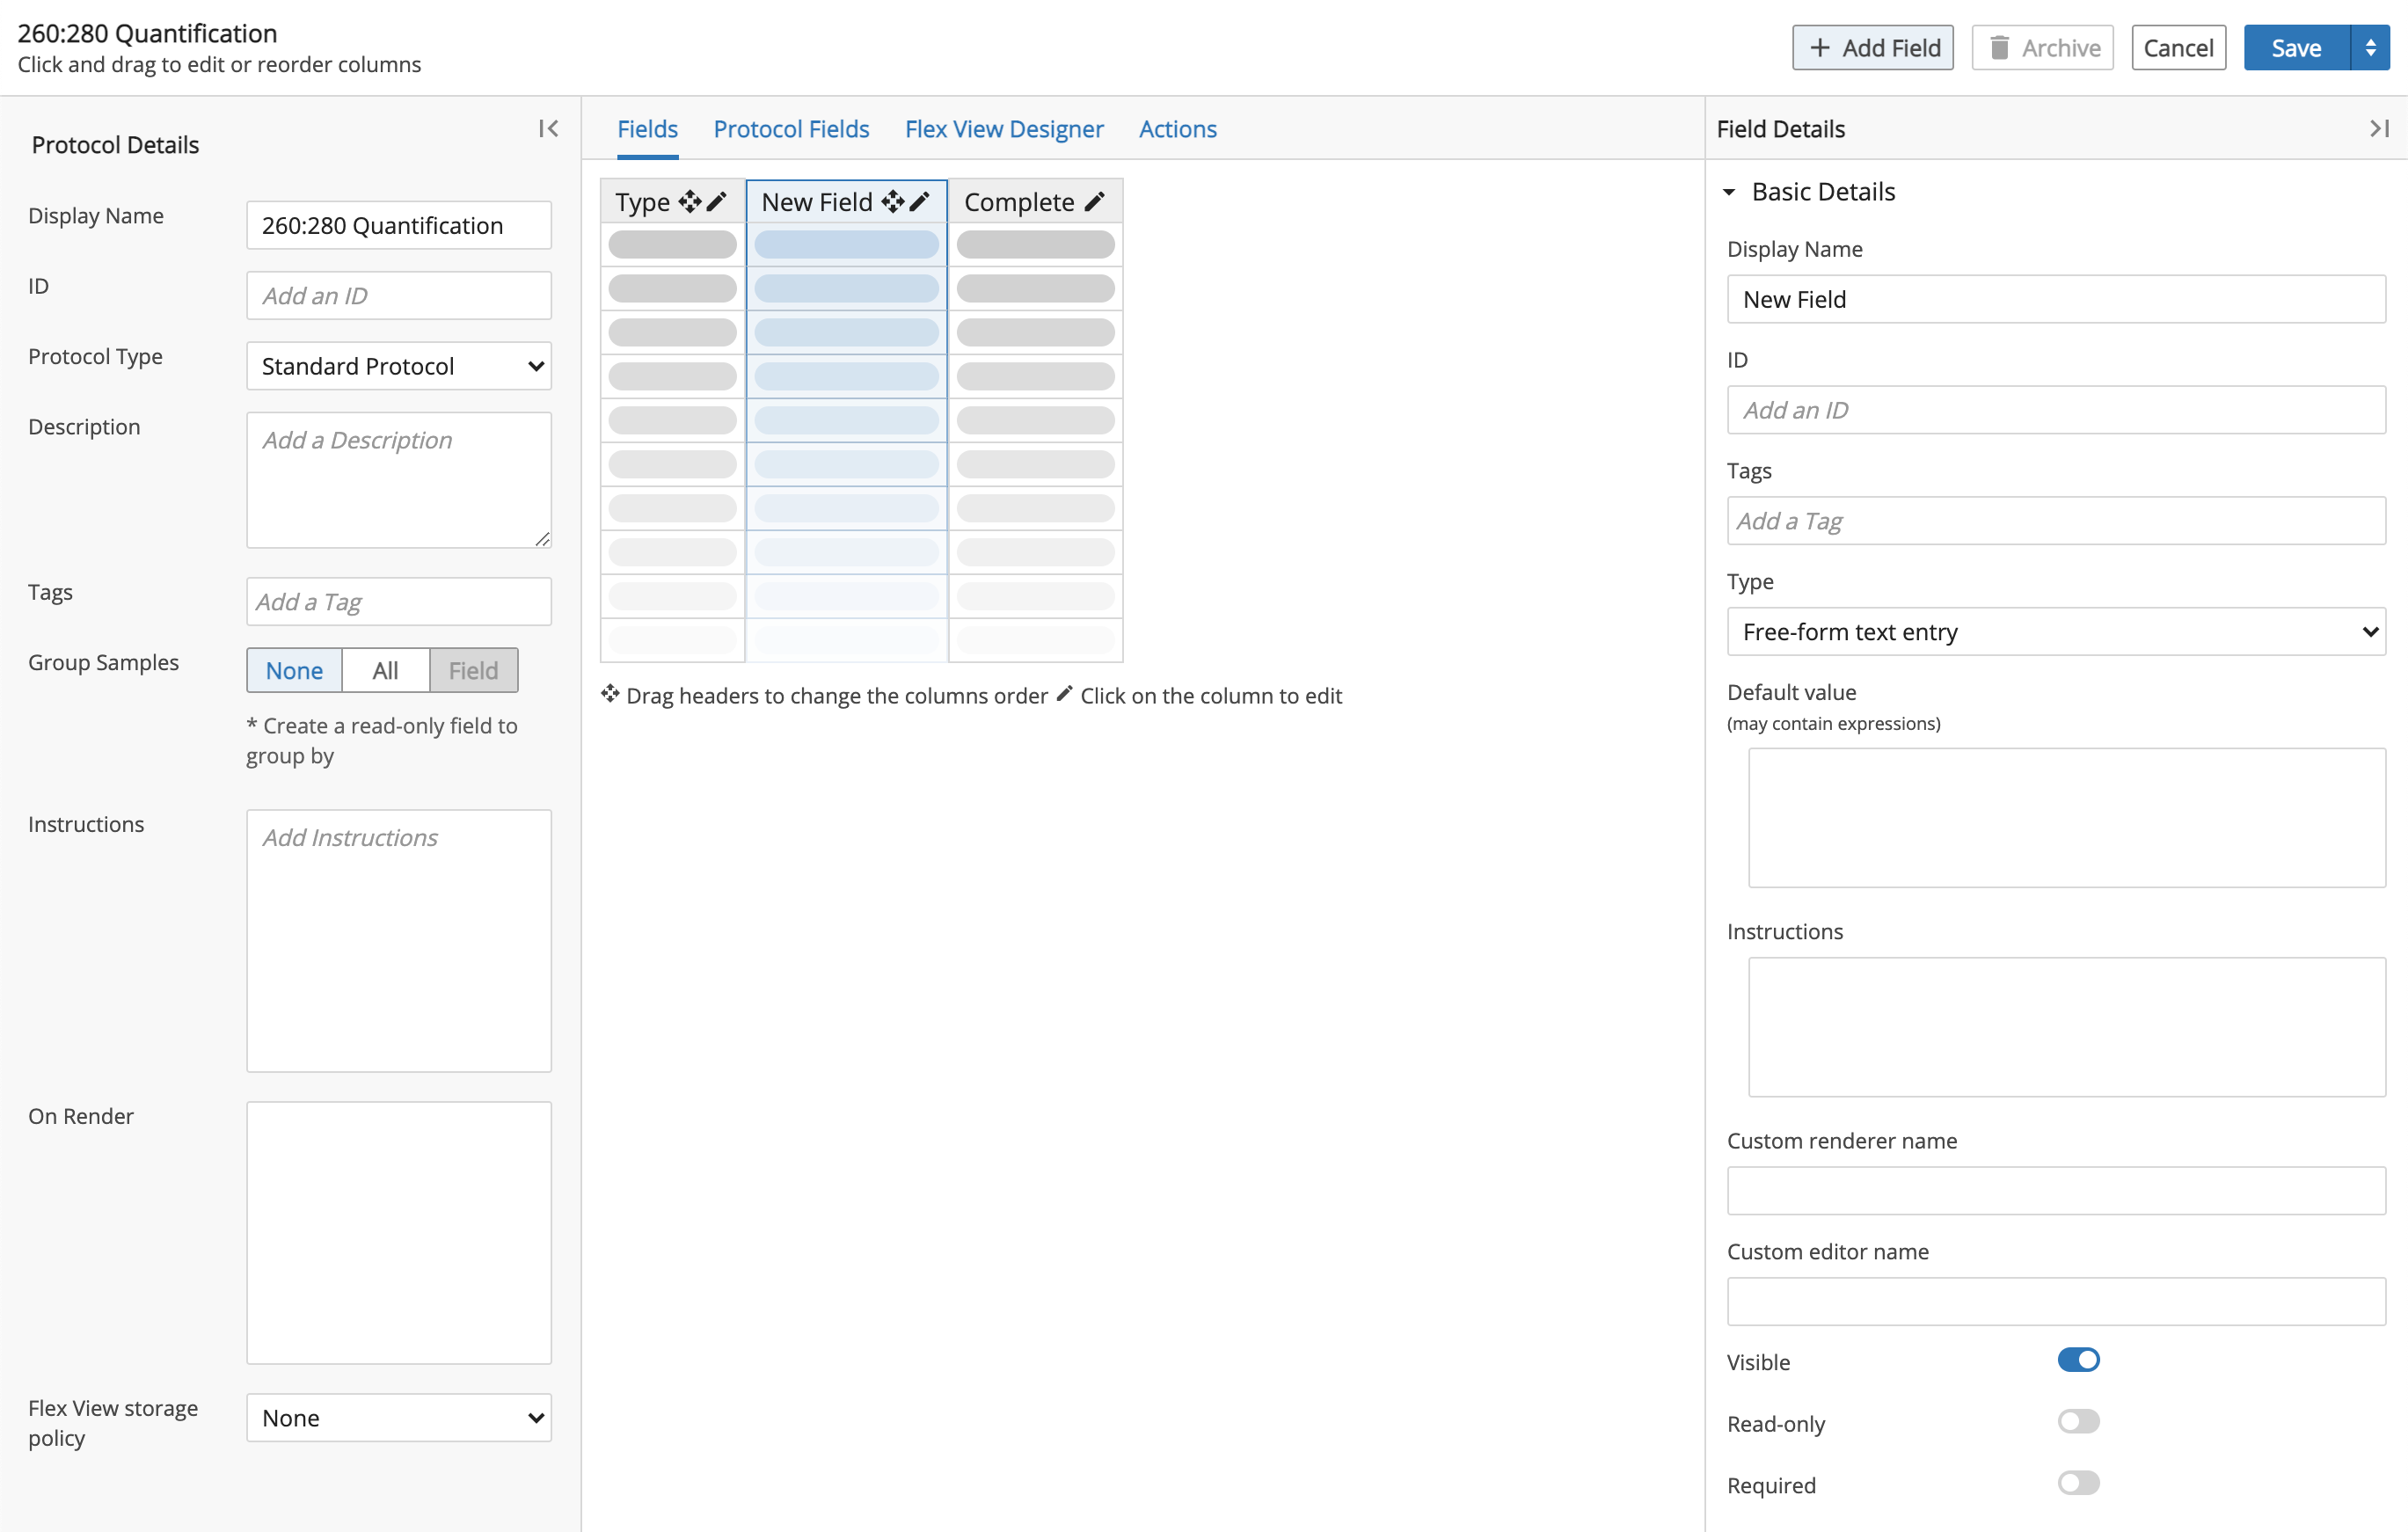
Enter "260:280 Quantification" in the Name field. Select No under the Use in manufacturing and select Standard Protocol as the Protocol Type.
Click + Add Field.
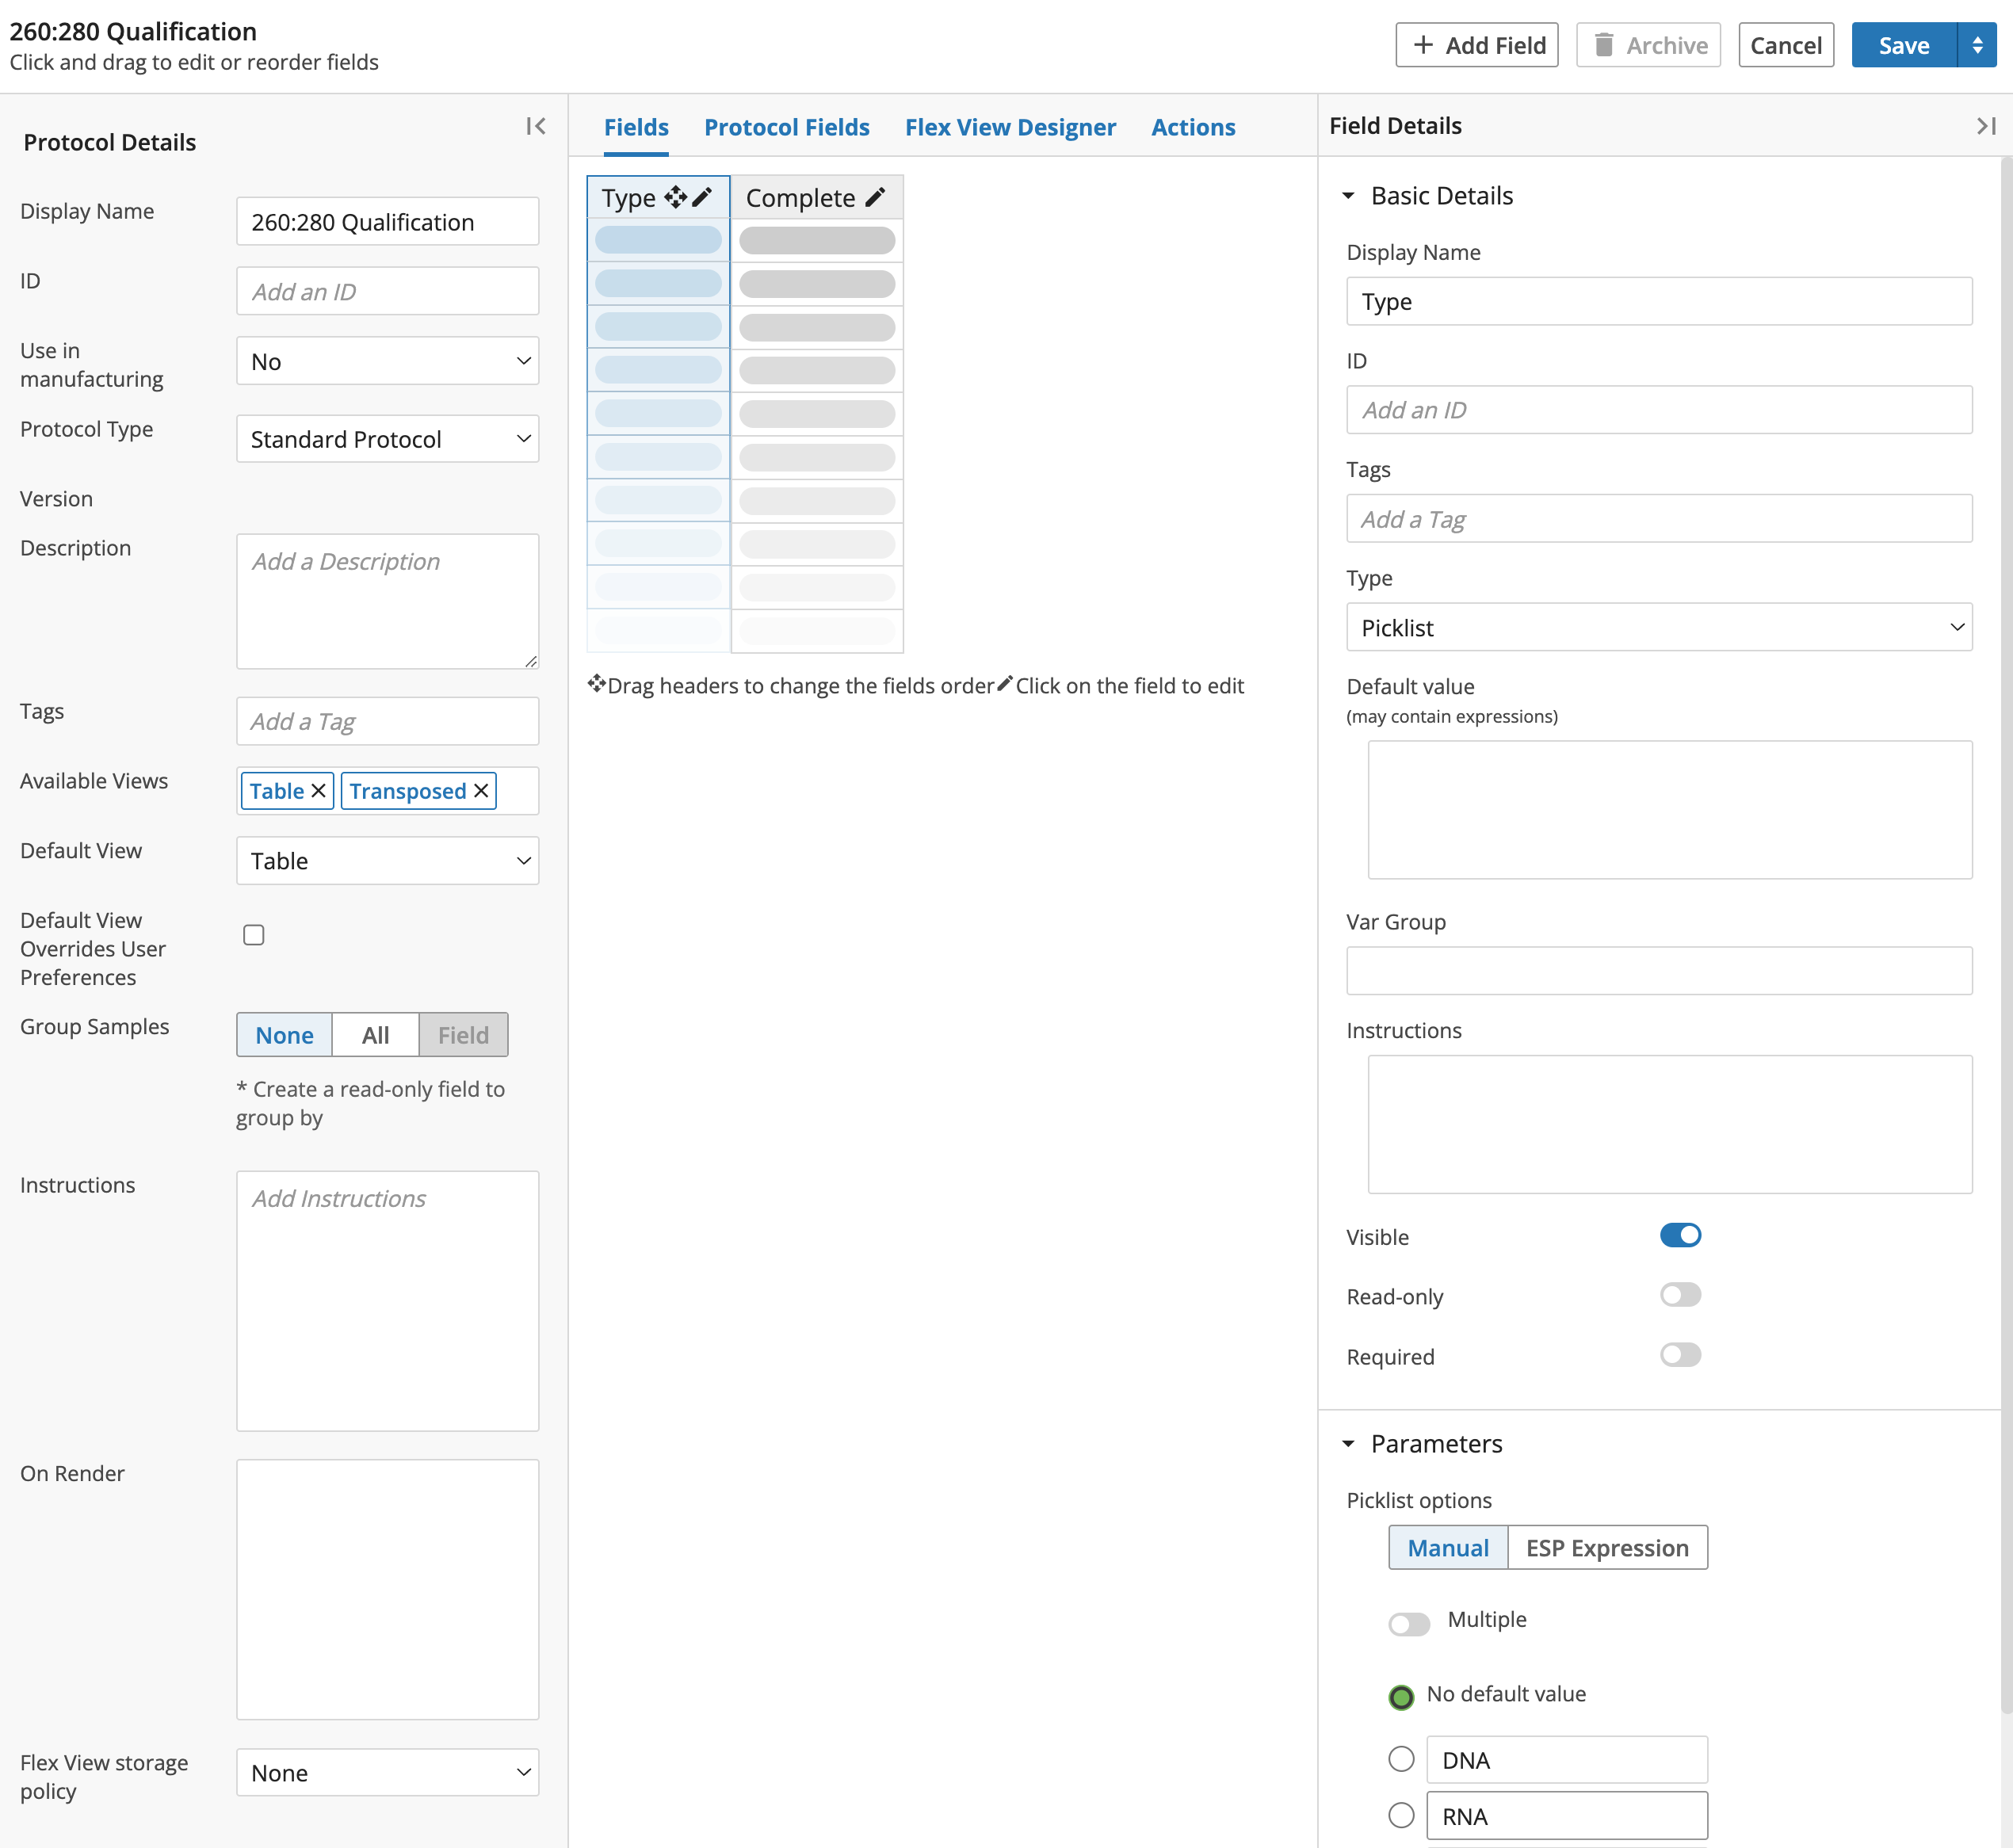
Enter "Type" in the Display Name field.
Select Picklist as the Type. Expand the Parameters section and enter "DNA" in the Enter option 0 field. Enter "RNA" in the Enter option 1 field.
Click + Add Field. (Observe that the Type field is saved and present in the Fields view and a new Field Details panel opens).
Enter "260:280 Ratio" in the Display Name field. Select Numbers only allowed as the Type.
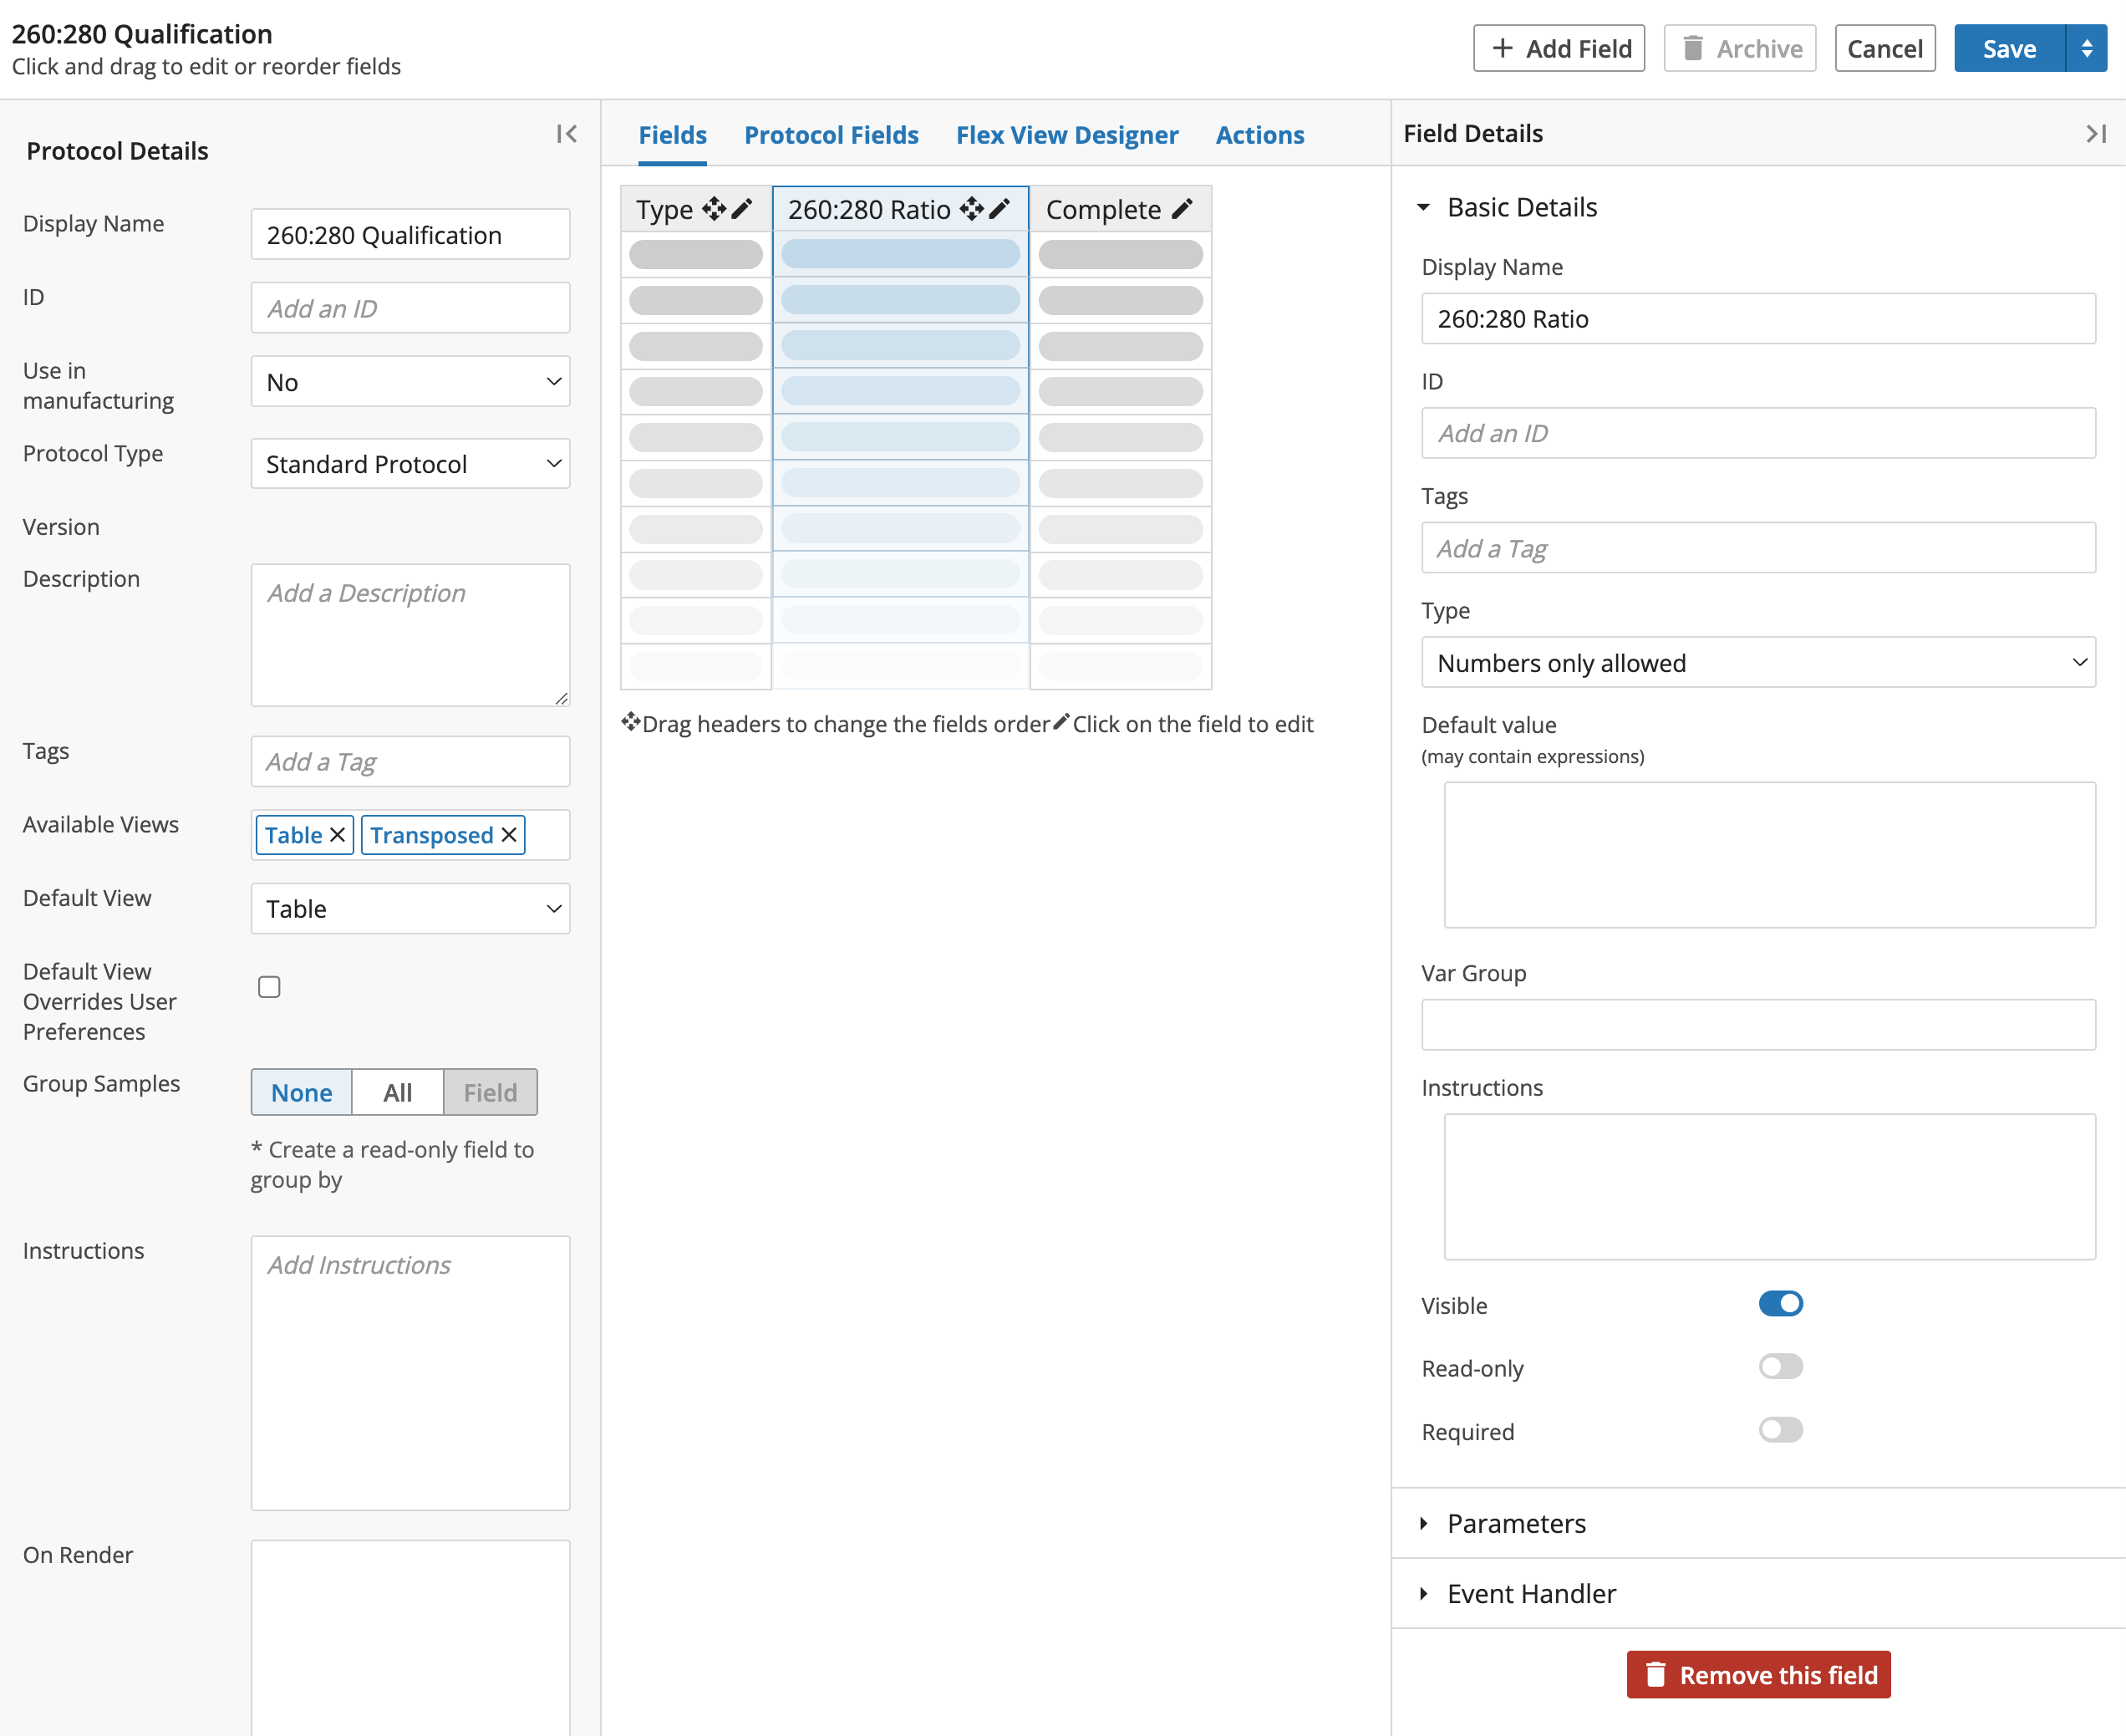
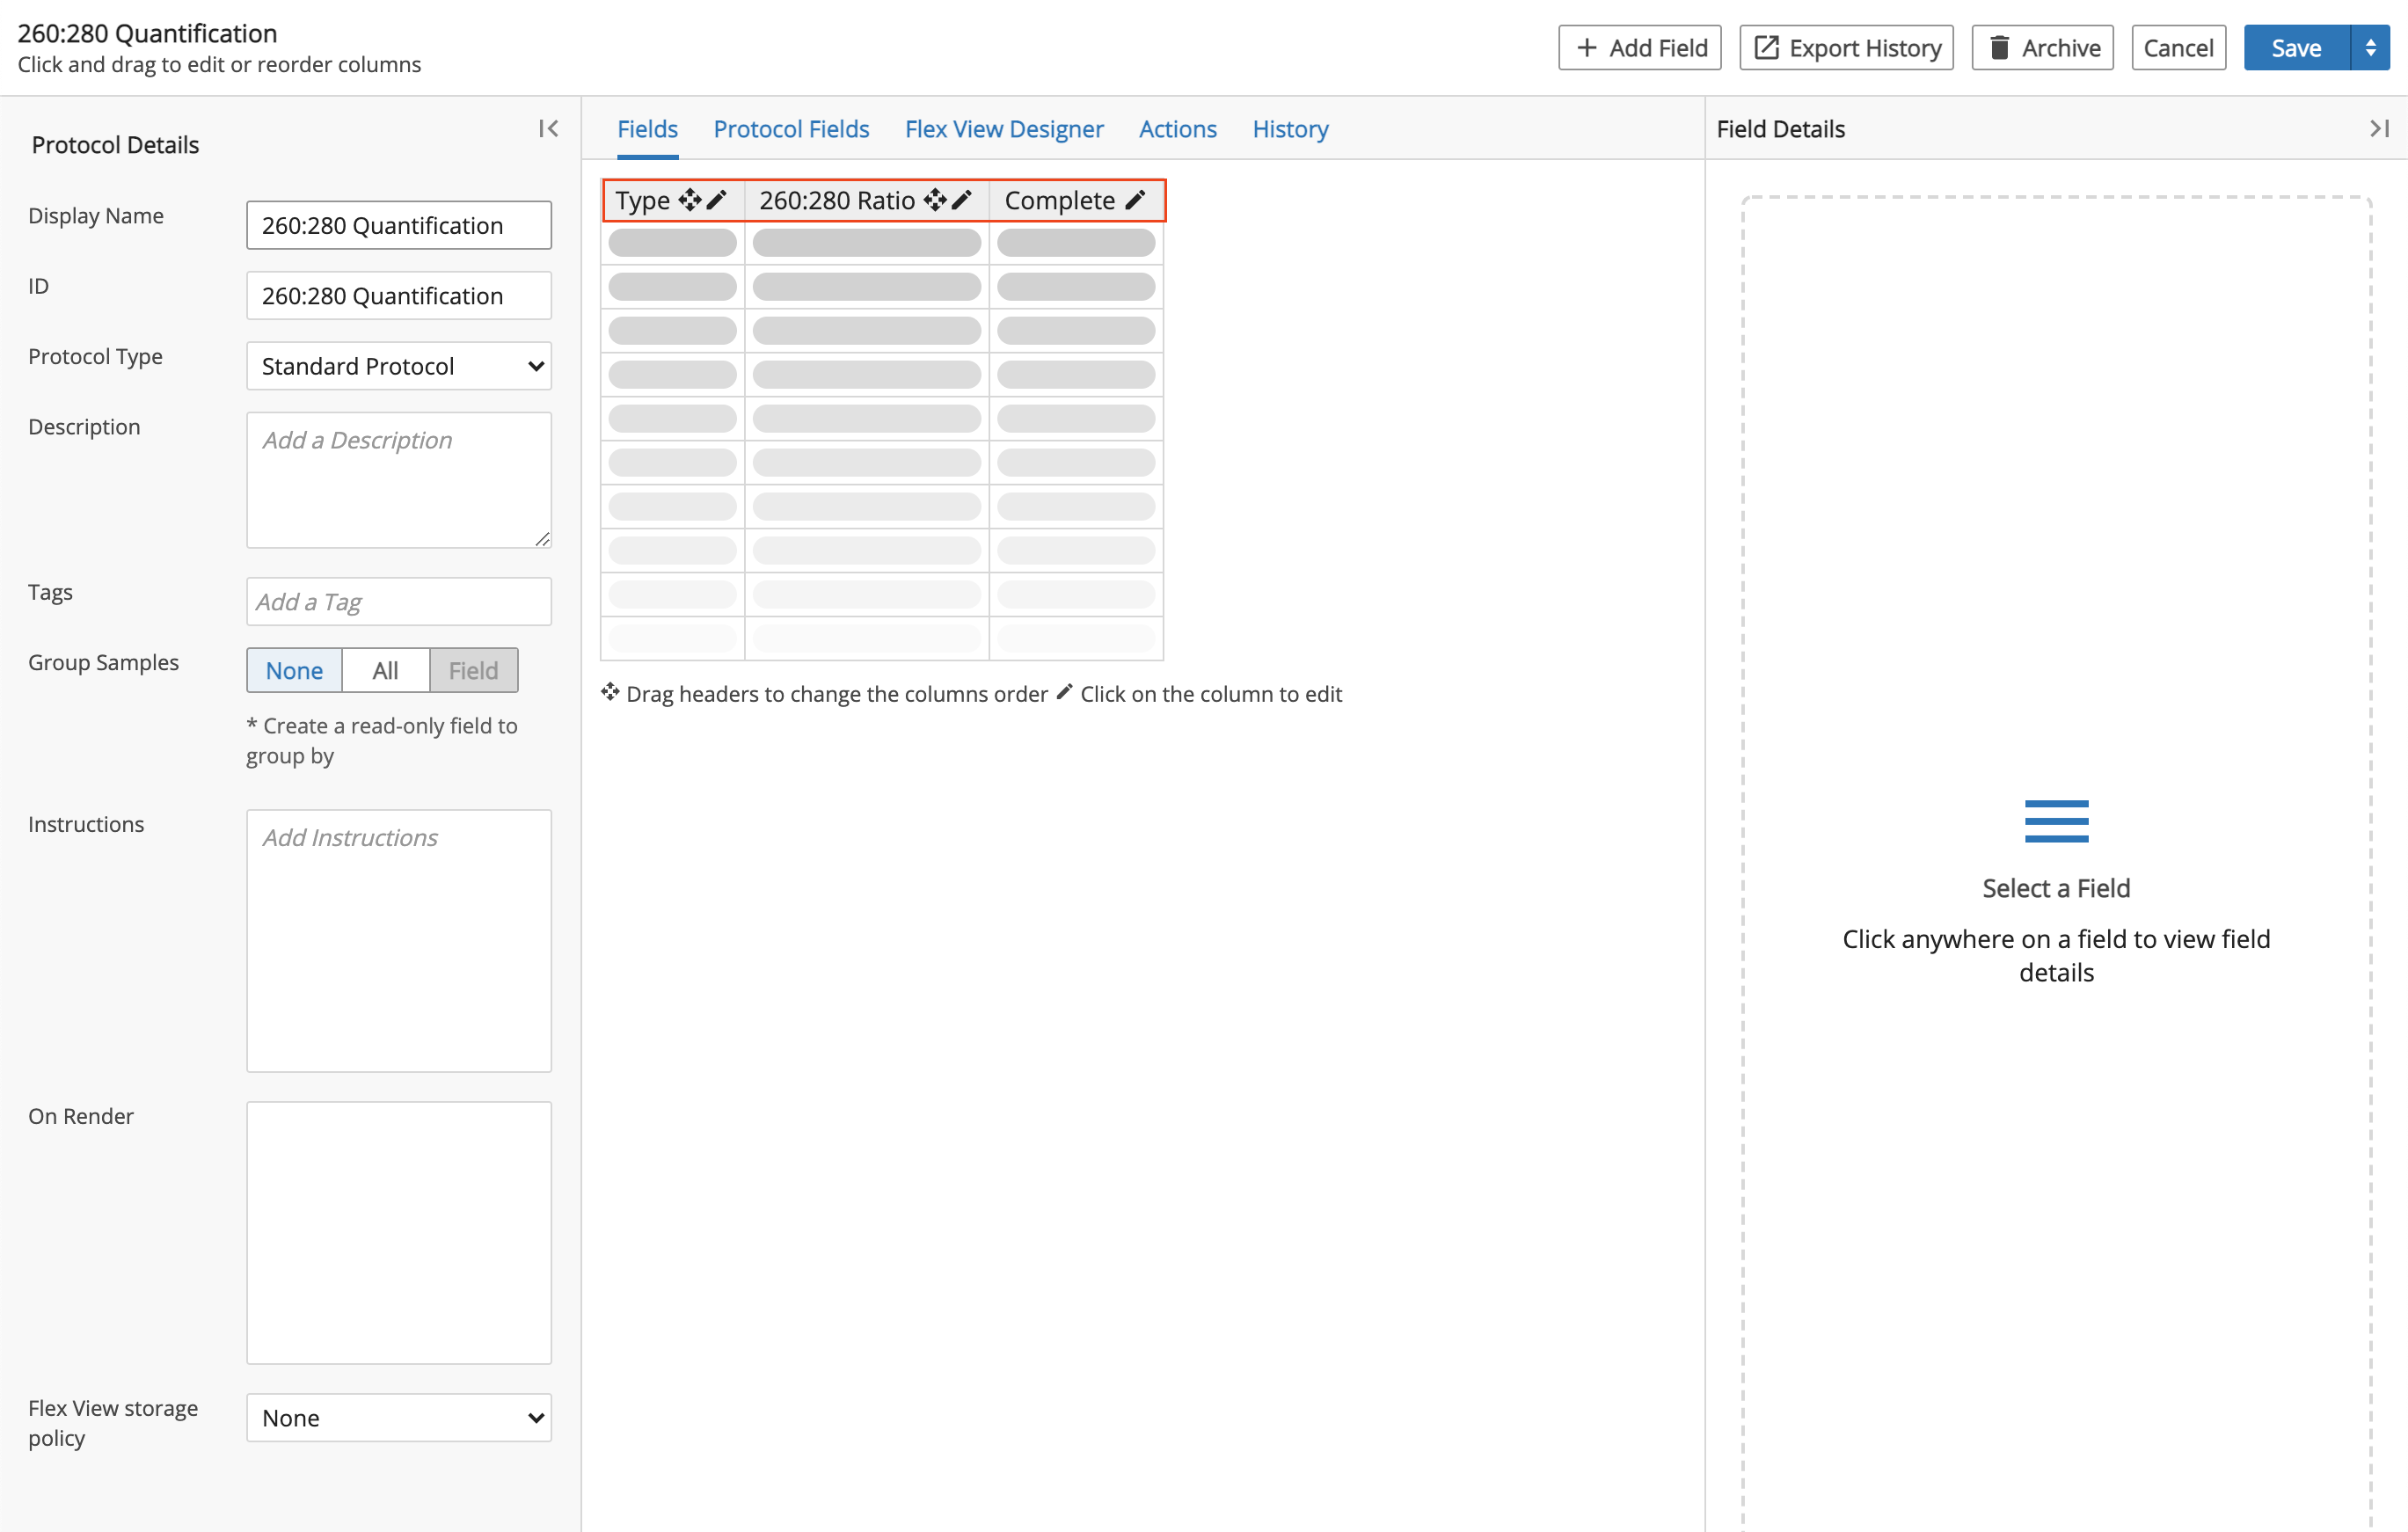
Click Save.
You now have a simple spreadsheet with three fields for data entry: a field to select the nucleic acid Entity type (i.e., DNA or RNA), a field to enter the measured ratio, and a default Complete field.
8.3. Create Task for Pipeline
In this section you will create a Task that will use a bash shell script to perform a purity test to determine if the measured ratio is within the accepted range for the Entity material (i.e., DNA or RNA). This Task will later be used when creating a Pipeline.
Hint
It is recommended that programmers create Tasks for Pipelines.
From the Analysis app, click the Tasks tab. Click + New Task.
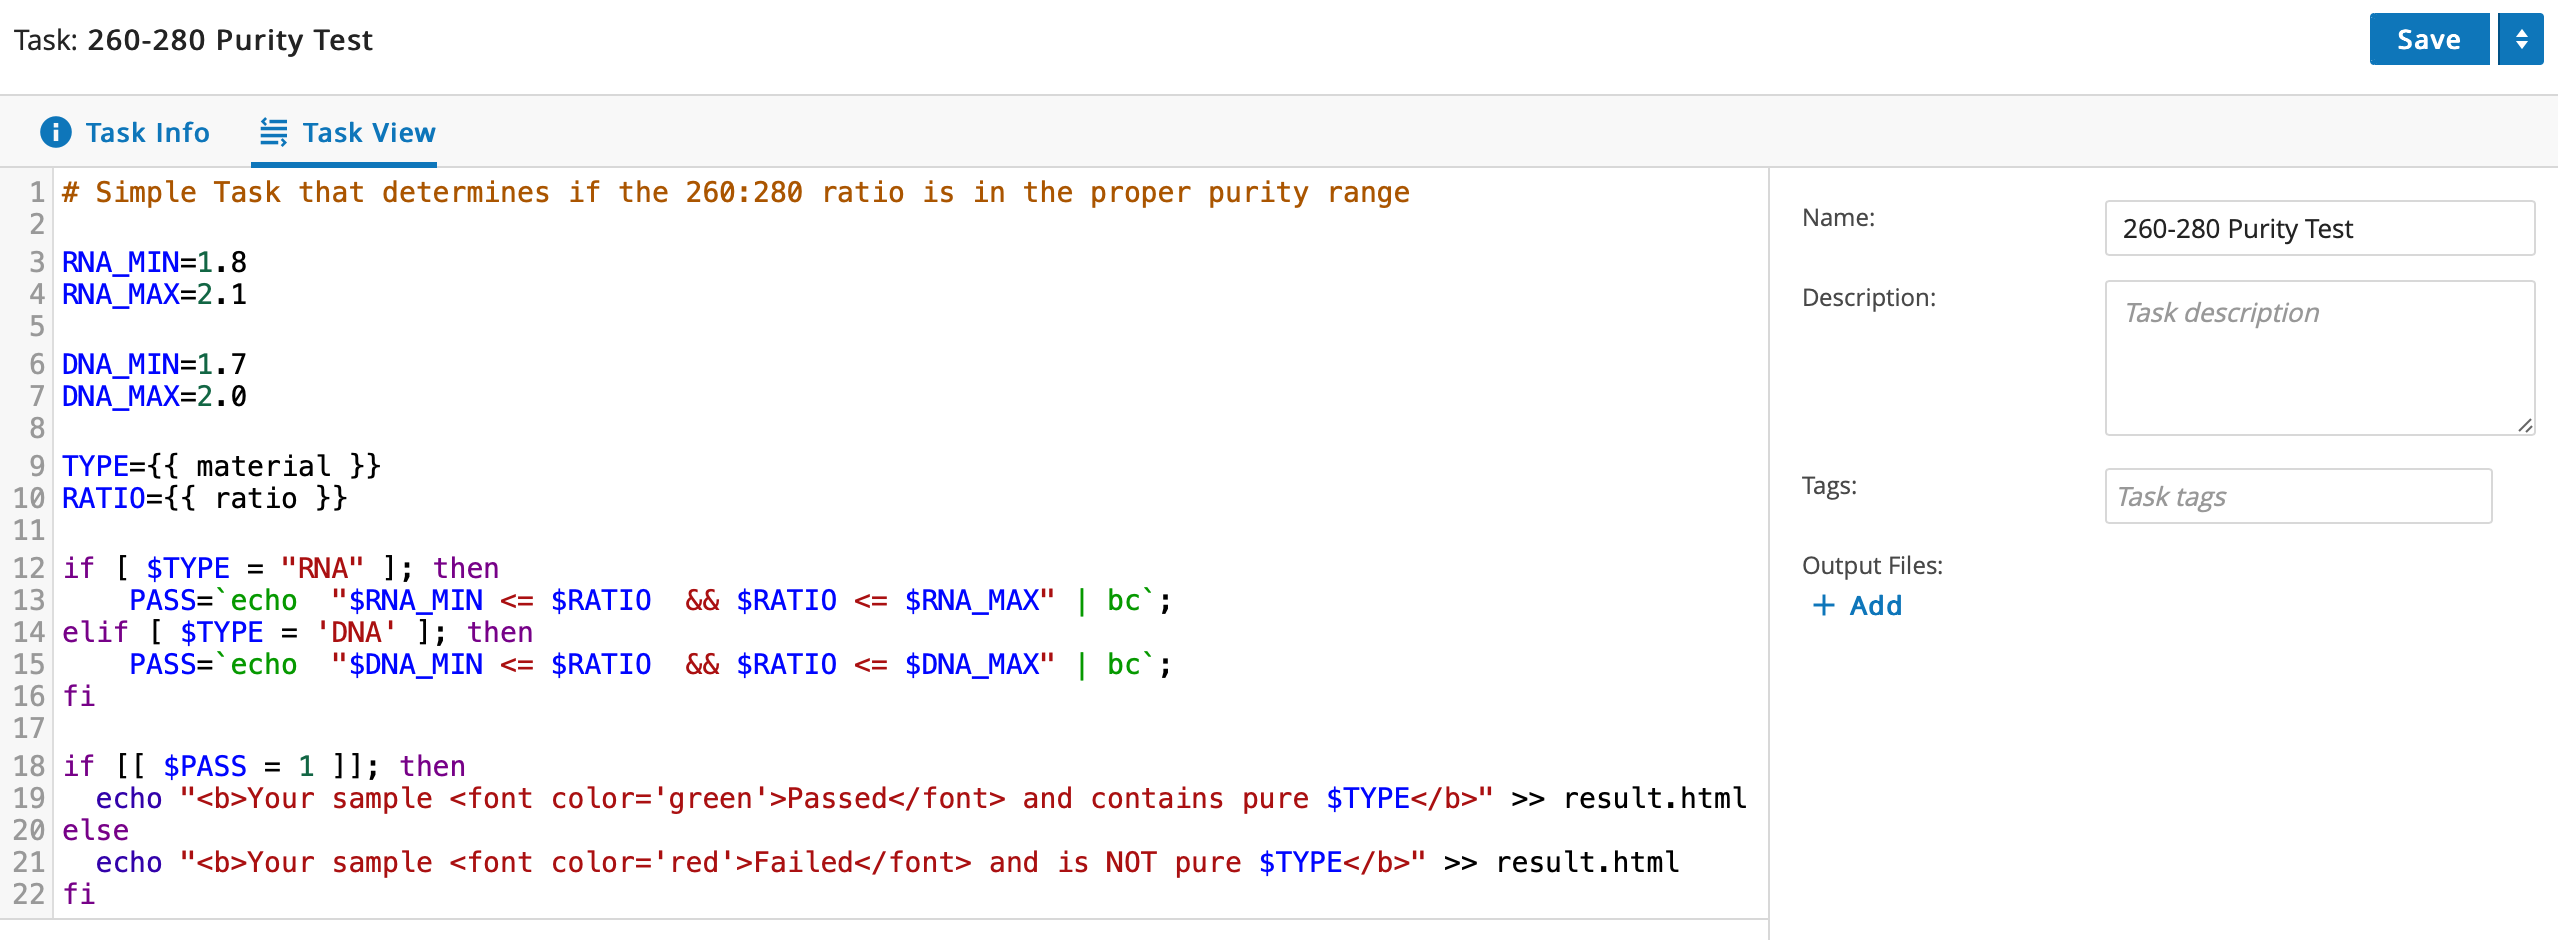
Enter "260-280 Purity Test" in the Name field.
Copy the purity test code below (from line 1 to line 22). Be aware the bc command line program referenced in this pipeline is not always available. If the command fails, try installing the bc program.
 1# Simple Task that determines if the 260:280 ratio is in the proper purity range
 2
 3RNA_MIN=1.8
 4RNA_MAX=2.1
 5
 6DNA_MIN=1.7
 7DNA_MAX=2.0
 8
 9TYPE={{ material }}
10RATIO={{ ratio }}
11
12if [ $TYPE = "RNA" ]; then
13    PASS=`echo  "$RNA_MIN <= $RATIO  && $RATIO <= $RNA_MAX" | bc`;
14elif [ $TYPE = 'DNA' ]; then
15    PASS=`echo  "$DNA_MIN <= $RATIO  && $RATIO <= $DNA_MAX" | bc`;
16fi
17
18if [[ $PASS = 1 ]]; then
19  echo "<b>Your sample <font color='green'>Passed</font> and contains pure $TYPE</b>" >> result.html
20else
21  echo "<b>Your sample <font color='red'>Failed</font> and is NOT pure $TYPE</b>" >> result.html
22fi
Note
Observe that
{{ material }}and{{ ratio }}have double curly braces around them.{{ ... }}denotes an L7|ESP Expression. L7|ESP Expressions are based on the Python programming language and can be any single-line Python statement (with some security restrictions). Expressions are evaluated before a Task is executed, allowing you to supply parameters to Tasks (in this case,materialandratio) and to perform simple computations.For more information on expressions, refer to L7|ESP Expression Language.
Paste the purity test code as shown below.
Click Save.
8.4. Create Registered File
In this section you will create a Registered File, which will track the result of the purity test.
Register the
result.htmlfile generated by the Task by clicking + Add below Output Files.Enter "Result Report" in the File Name field. Enter
htmlin the File Type field. Enter{{ 'result.html' }}in the Expression field. Click Save.
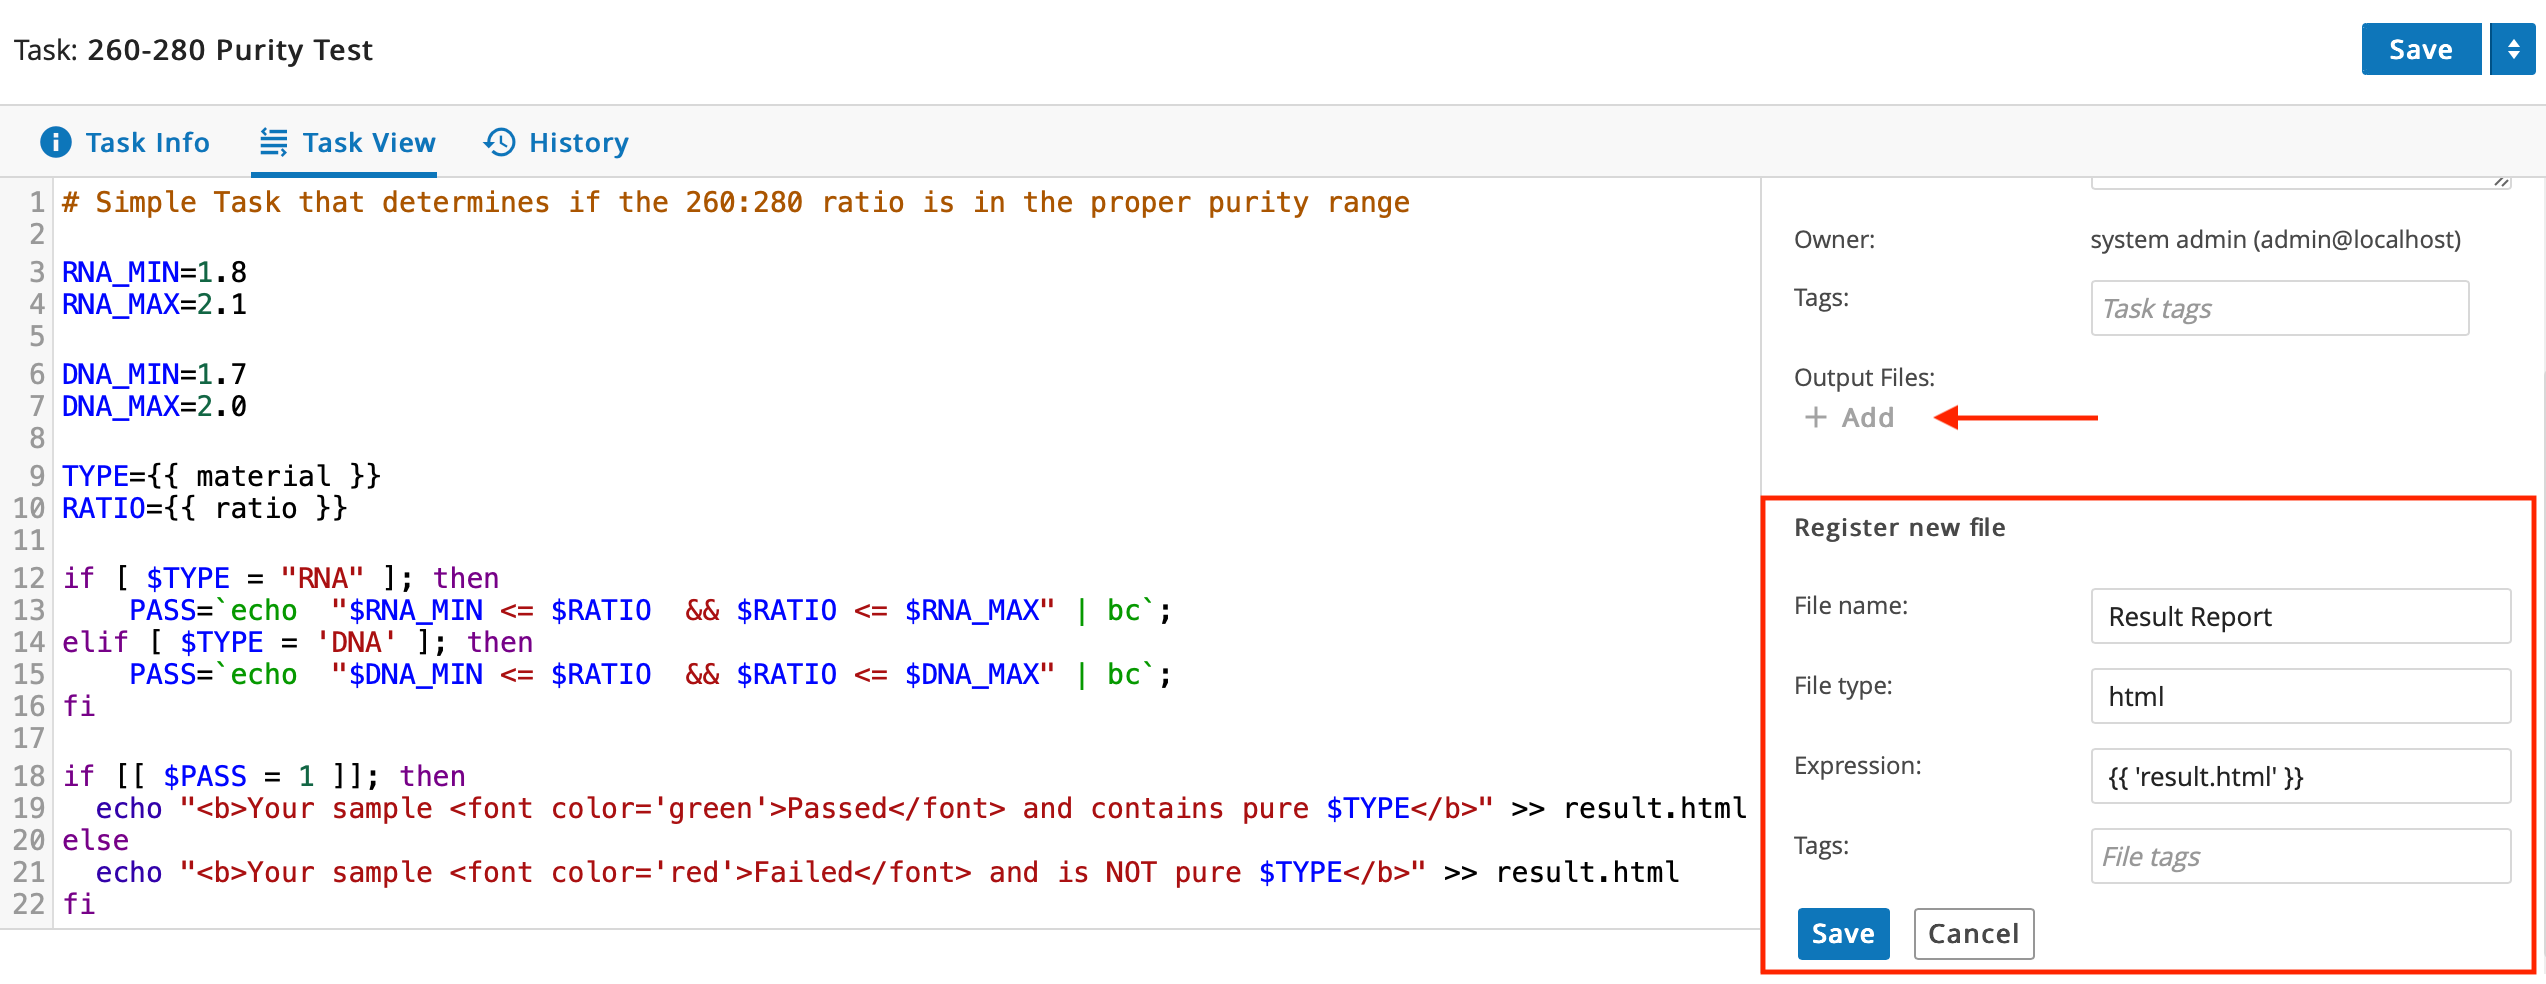
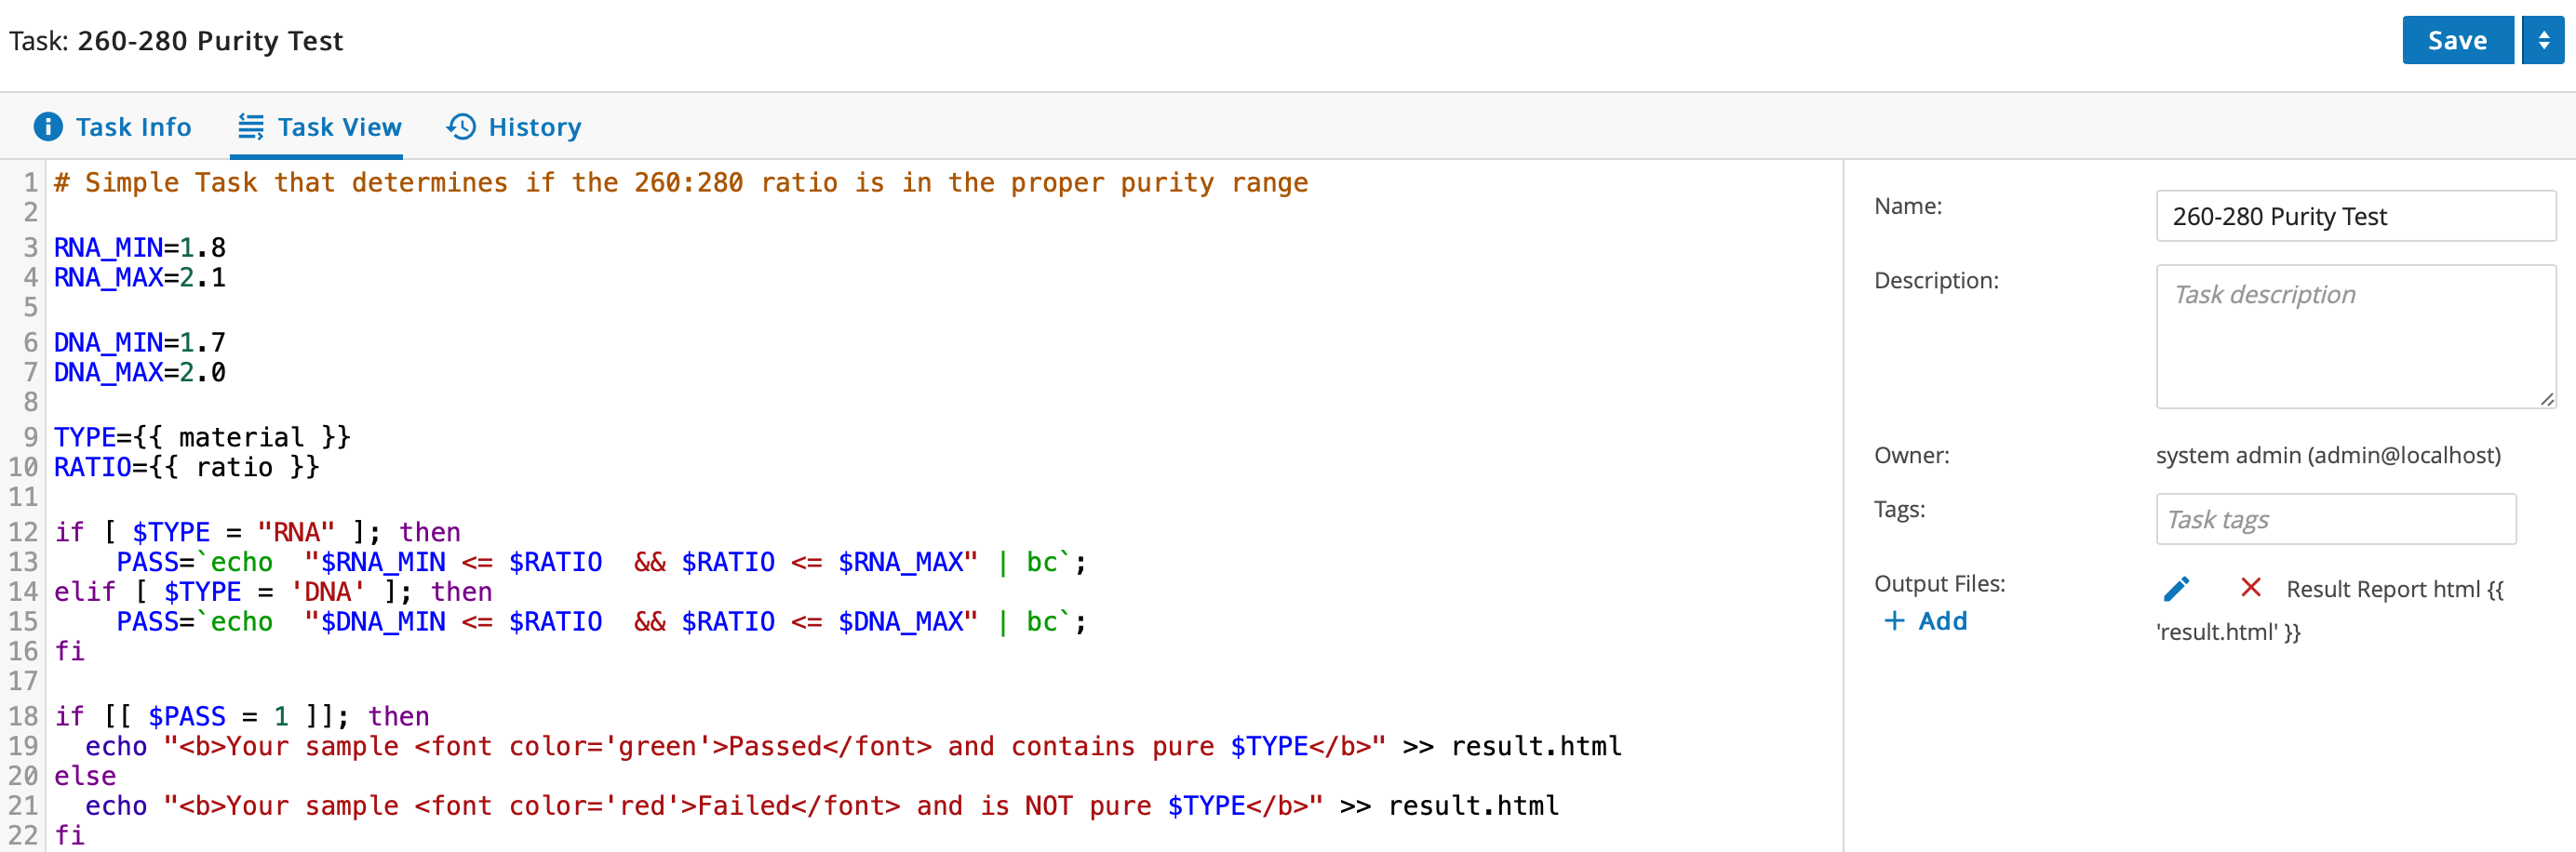
Click Save to save the updated Task.
Every time the Task is executed, the result.html file generated in the Task directory is registered with L7|ESP and then added to the Task's provenance (and, by extension, the Pipeline's provenance and the Entity's provenance). To learn more about L7|ESP provenance system, refer to Provenance System.
The final 260:280 Purity Test Task looks like this:
Note
Files are typically registered by Tasks when Pipelines are executed, but you can also register files using the command line tools. To register a file from the command line, use the l7 command:
$ /path/to/l7 file register /path/to/file
8.5. Create Pipeline
In this section you will create a Pipeline, which will use the Task you created earlier, to generate quality control reports for DNA and RNA purification. This Pipeline will later be used to create a Pipeline Protocol.
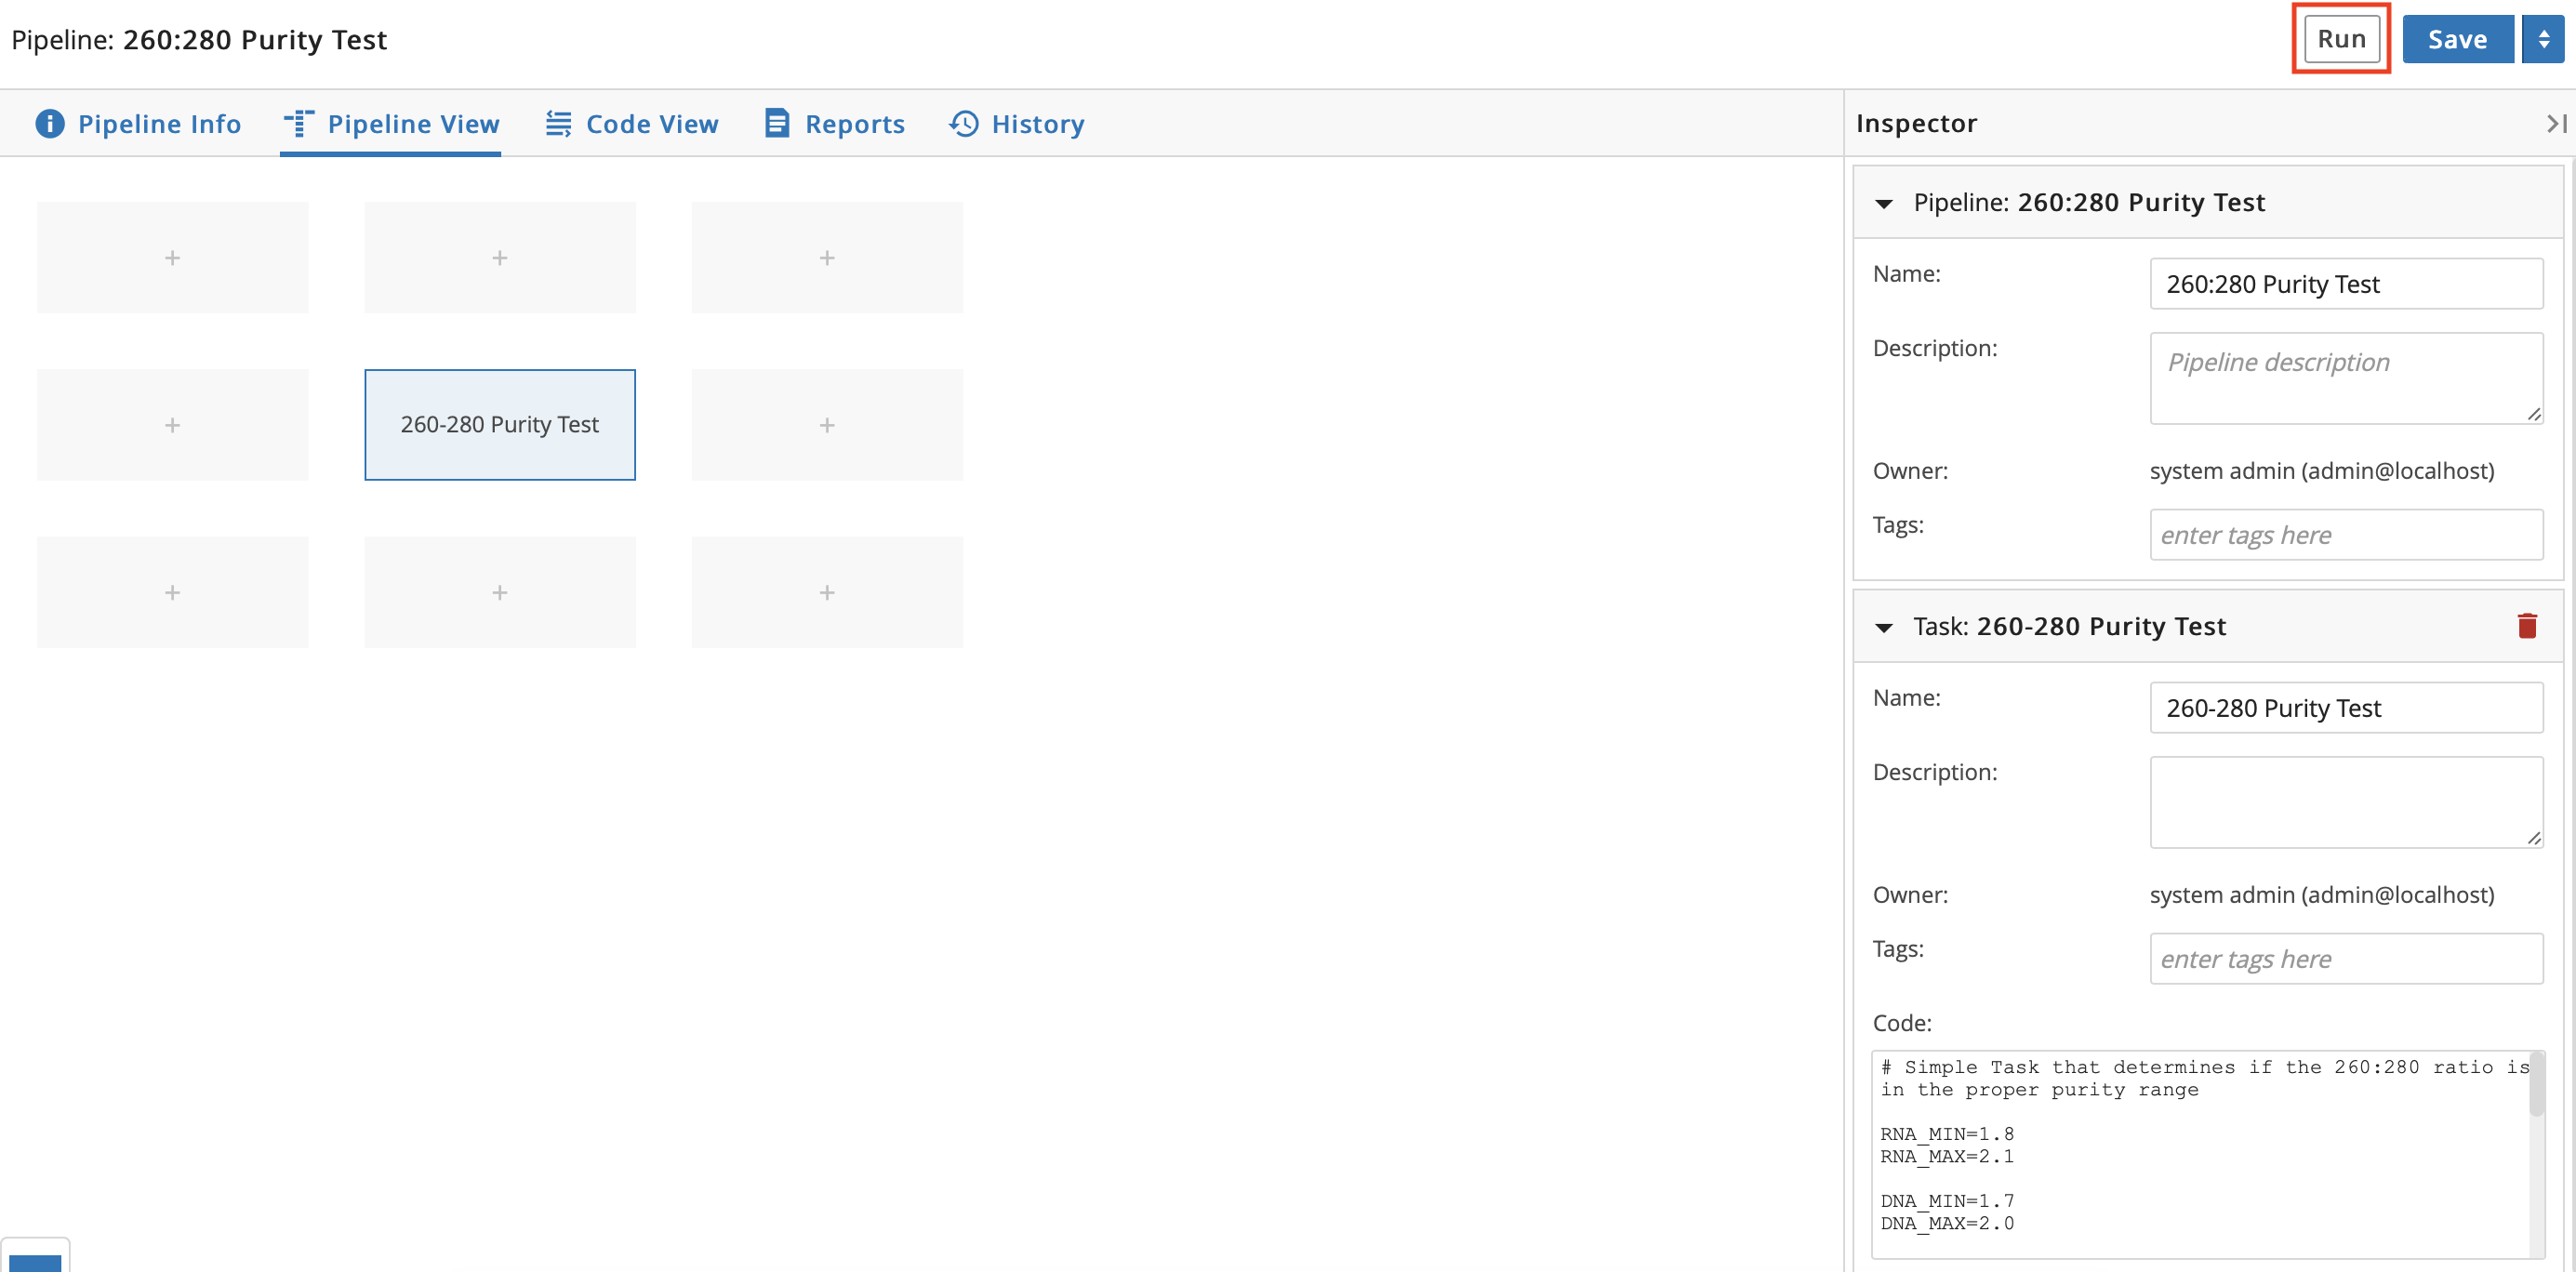
From the Analysis app, click the Pipelines tab. Click + New Pipeline.

Enter "260-280 Purity Test" in the Name field. Click the blank Task box.
Start entering "260" and select "260-280 Purity Test" from the auto-complete list.
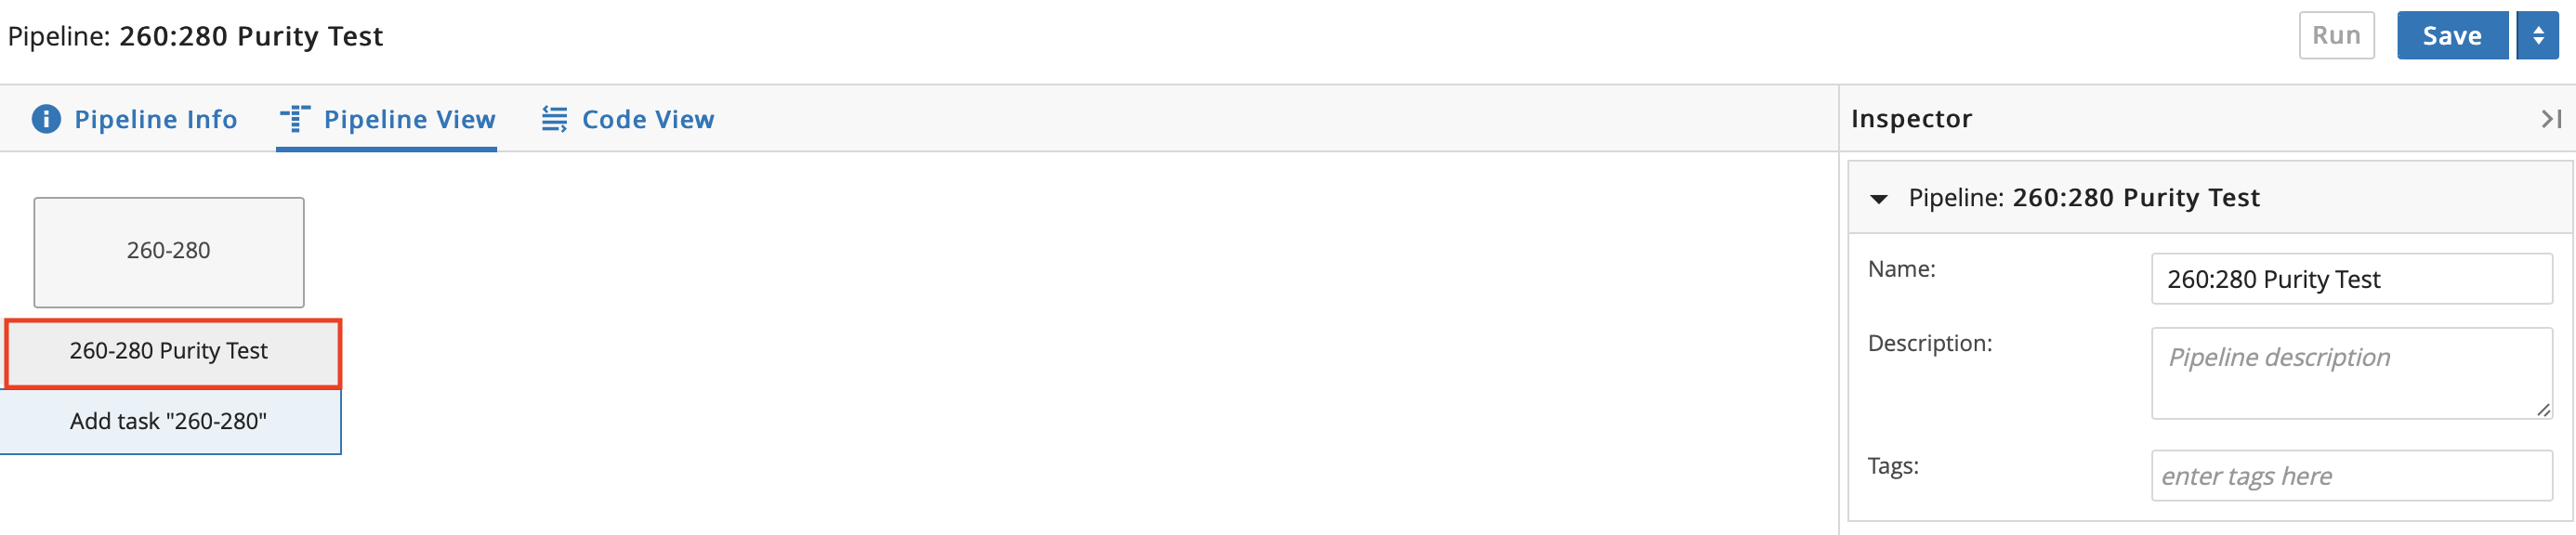
Click Save.
8.5.1. Test Pipeline
In this section you will test the new Pipeline you created.
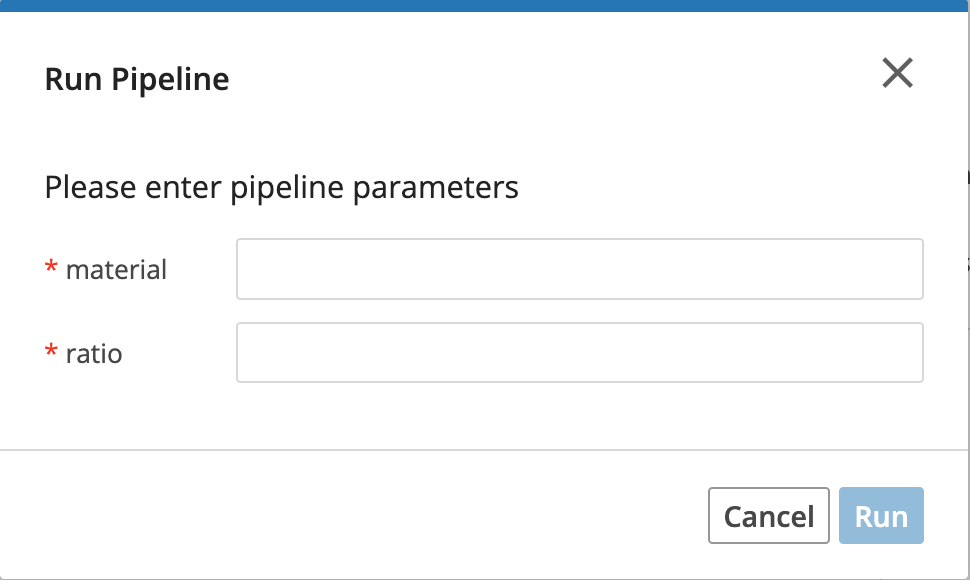
Click Run.
Enter "DNA" for the
materialparameter. Enter "1.9" for theratioparameter. Click Run.
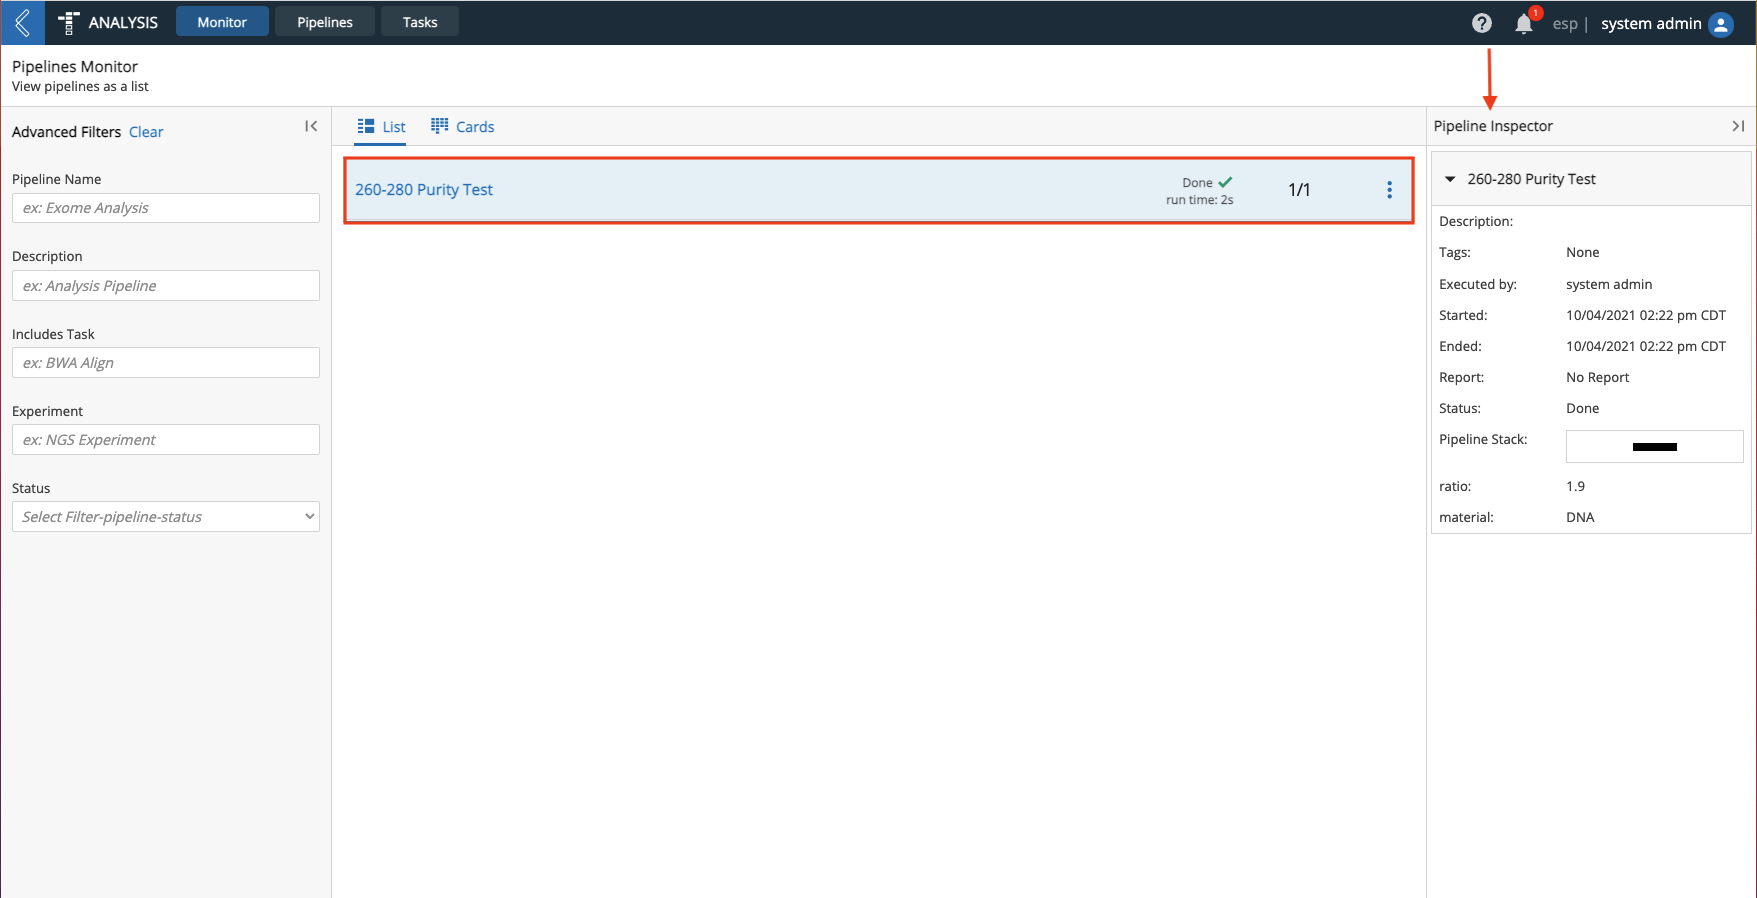
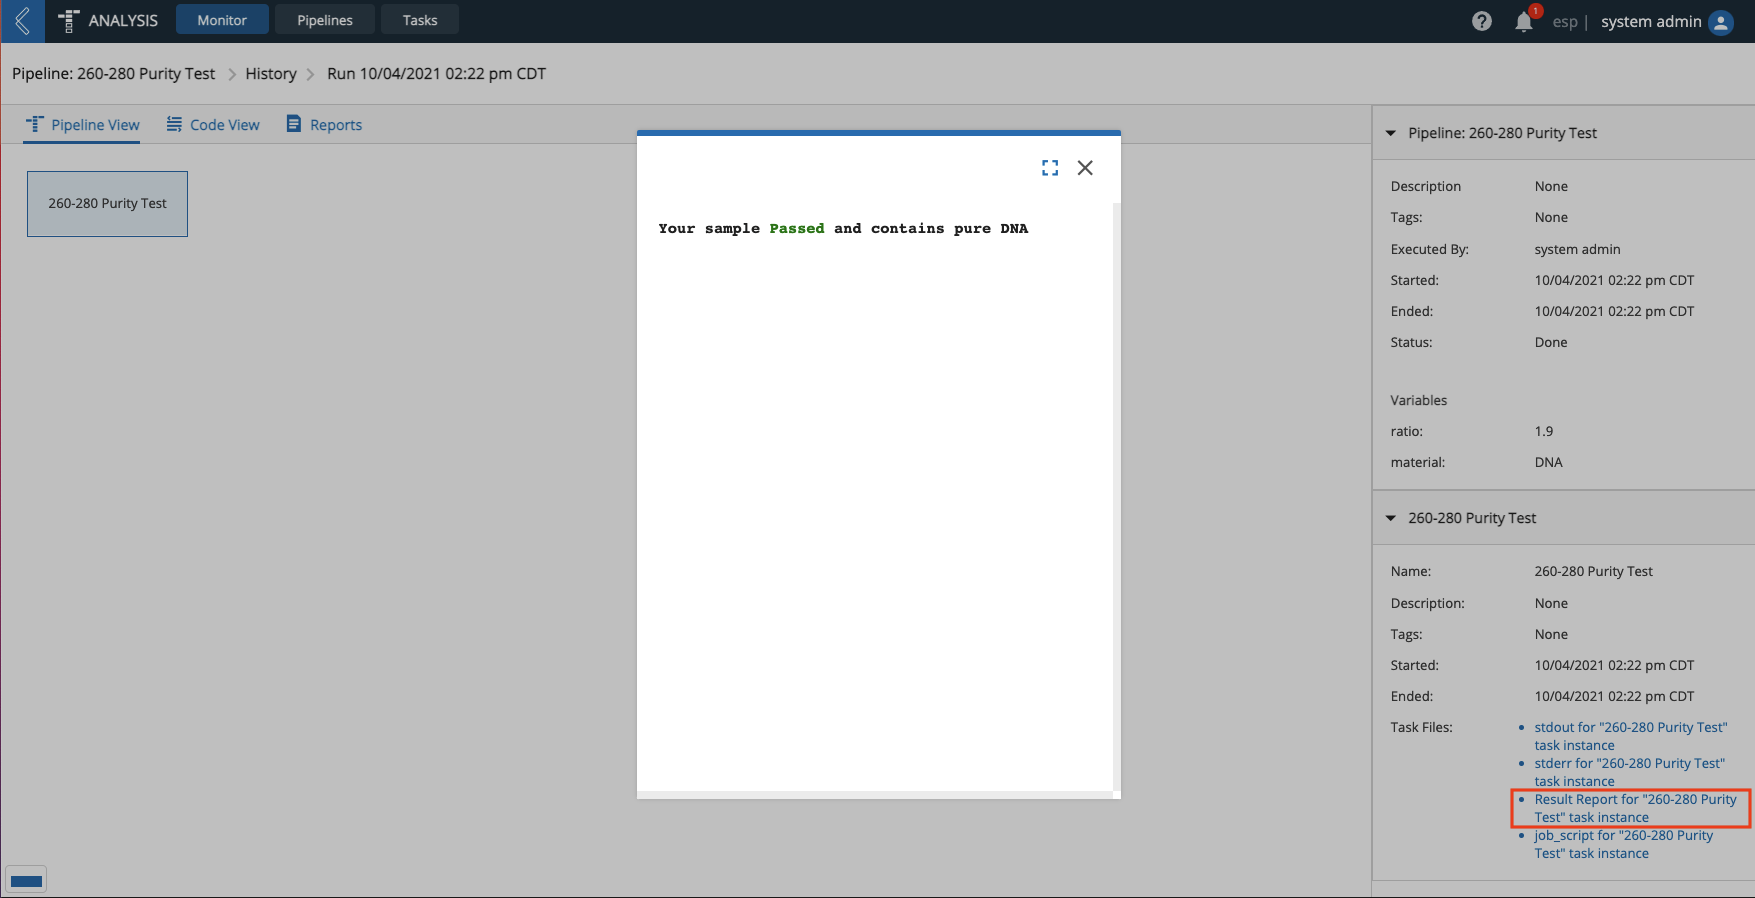
Click the Monitor tab. Click the "260:280 Purity Test" row for the DNA/1.9 run. The Pipeline Inspector on the right displays basic information about the executed Pipeline.
Navigate through the results as follows:
Click the vertical ellipsis and then click View Details. This will redirect you to a page that looks similar to the Pipeline Builder. The key difference is that the Run Details page displays actual details from the run. Click the Task (the "260-280 Purity Test" box) to view run-time details, including associated Task Files. The Task Inspector on the right has links to the complete Task Script (as executed on the server); stderr and stdout for the script; and also a link to the Registered File, Result Report.
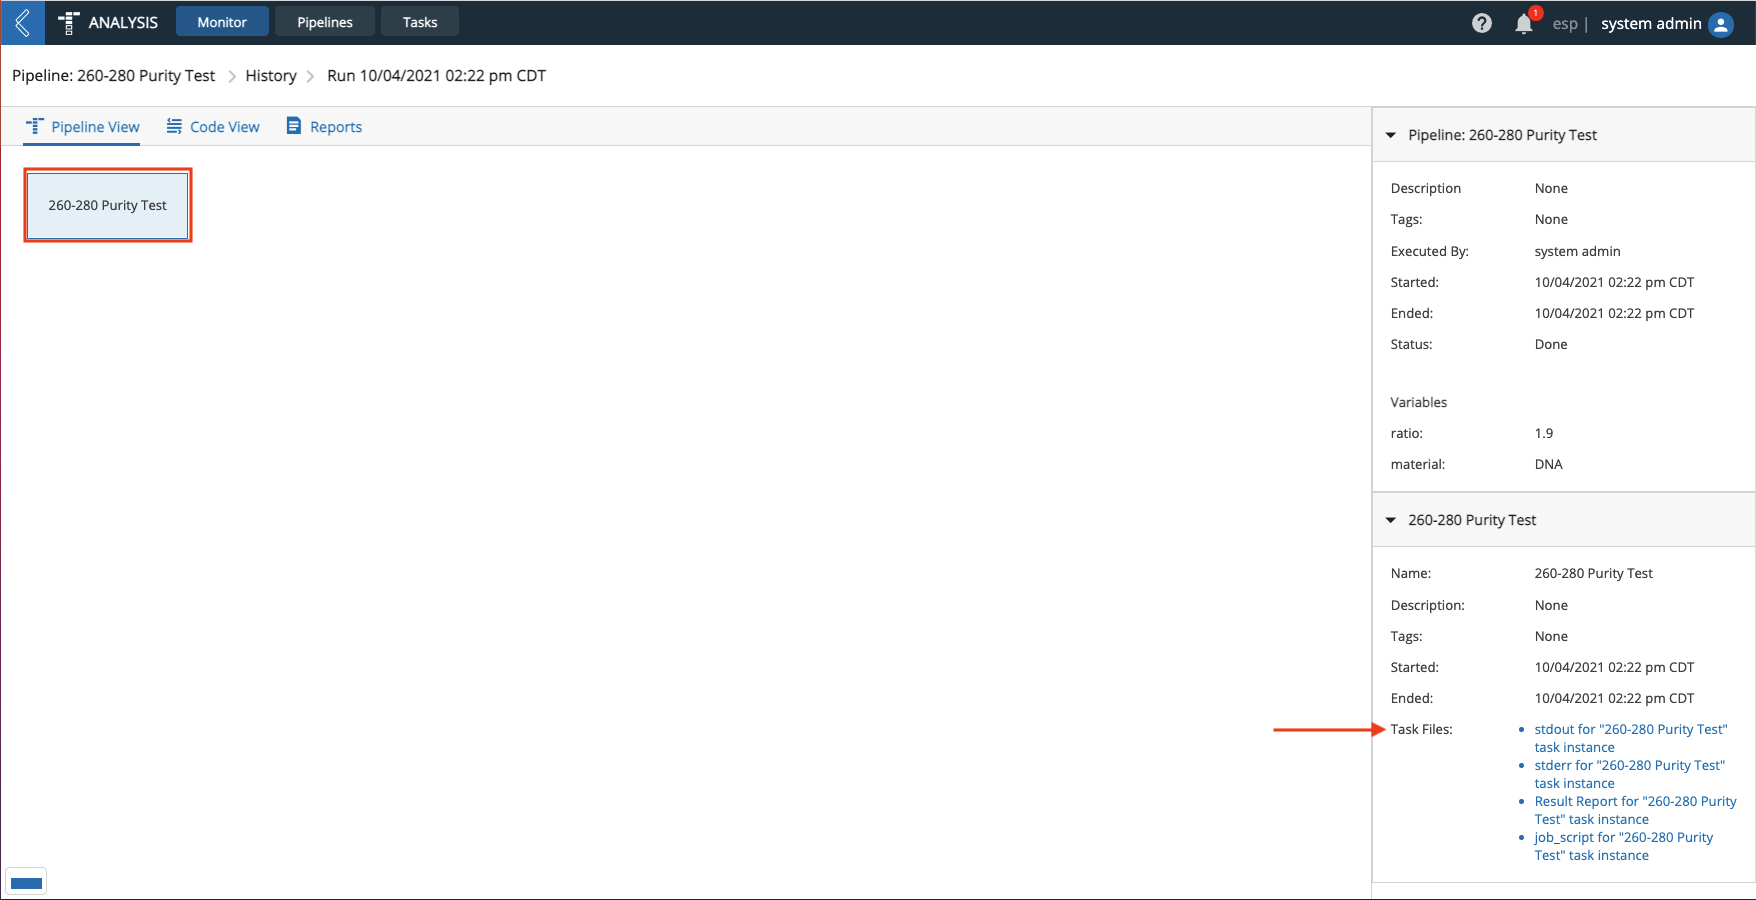
Click Result Report... to view the contents of the Registered File. You have now successfully tested the Pipeline.
8.6. Create Pipeline Report
The Pipeline and Registered File demonstrate how to create a simple Pipeline and make the results available in L7|ESP; however, locating and viewing Files generated by Pipelines through Run Details can be cumbersome, especially if the Pipeline generates many Files not used for Reports (e.g., such as those tracked for provenance purposes). Additionally, you may want to display data from multiple Registered Files at once. L7|ESP’s Report Builder provides such a service.
In this section you will use the Registered File to create a Report for the Pipeline.
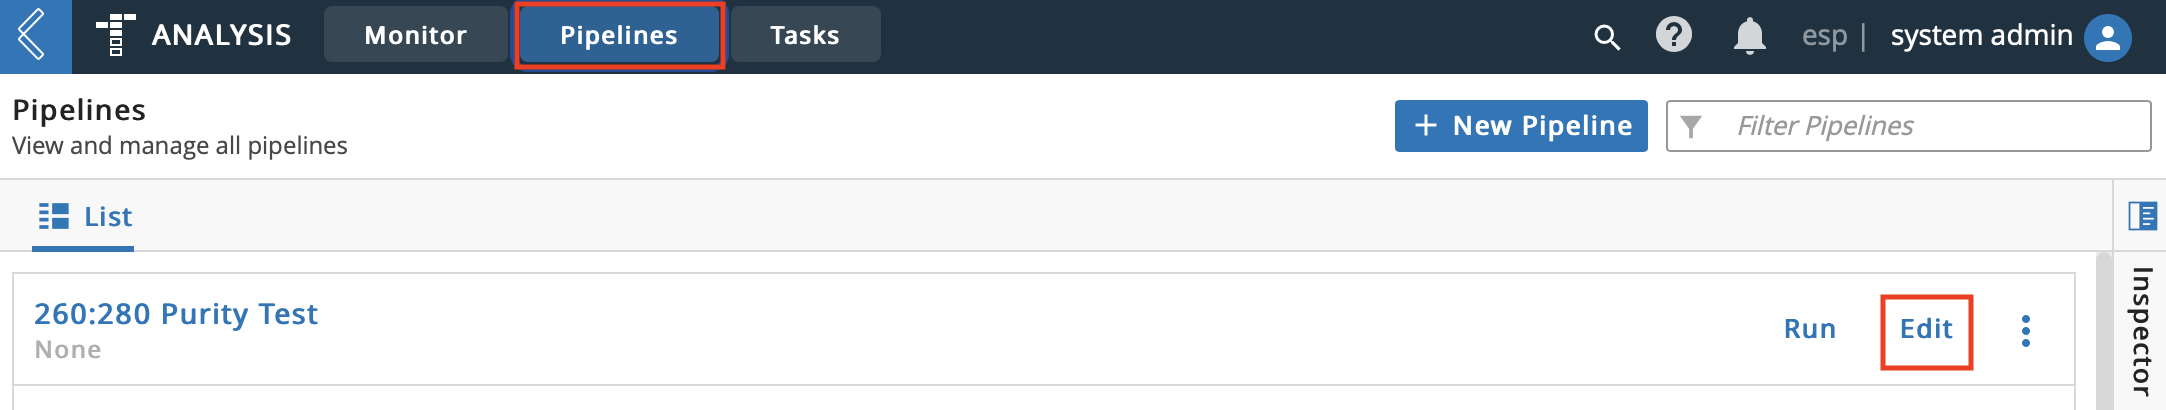
From the Analysis app, click Pipelines. Click Edit on the 260:280 Purity Test row.
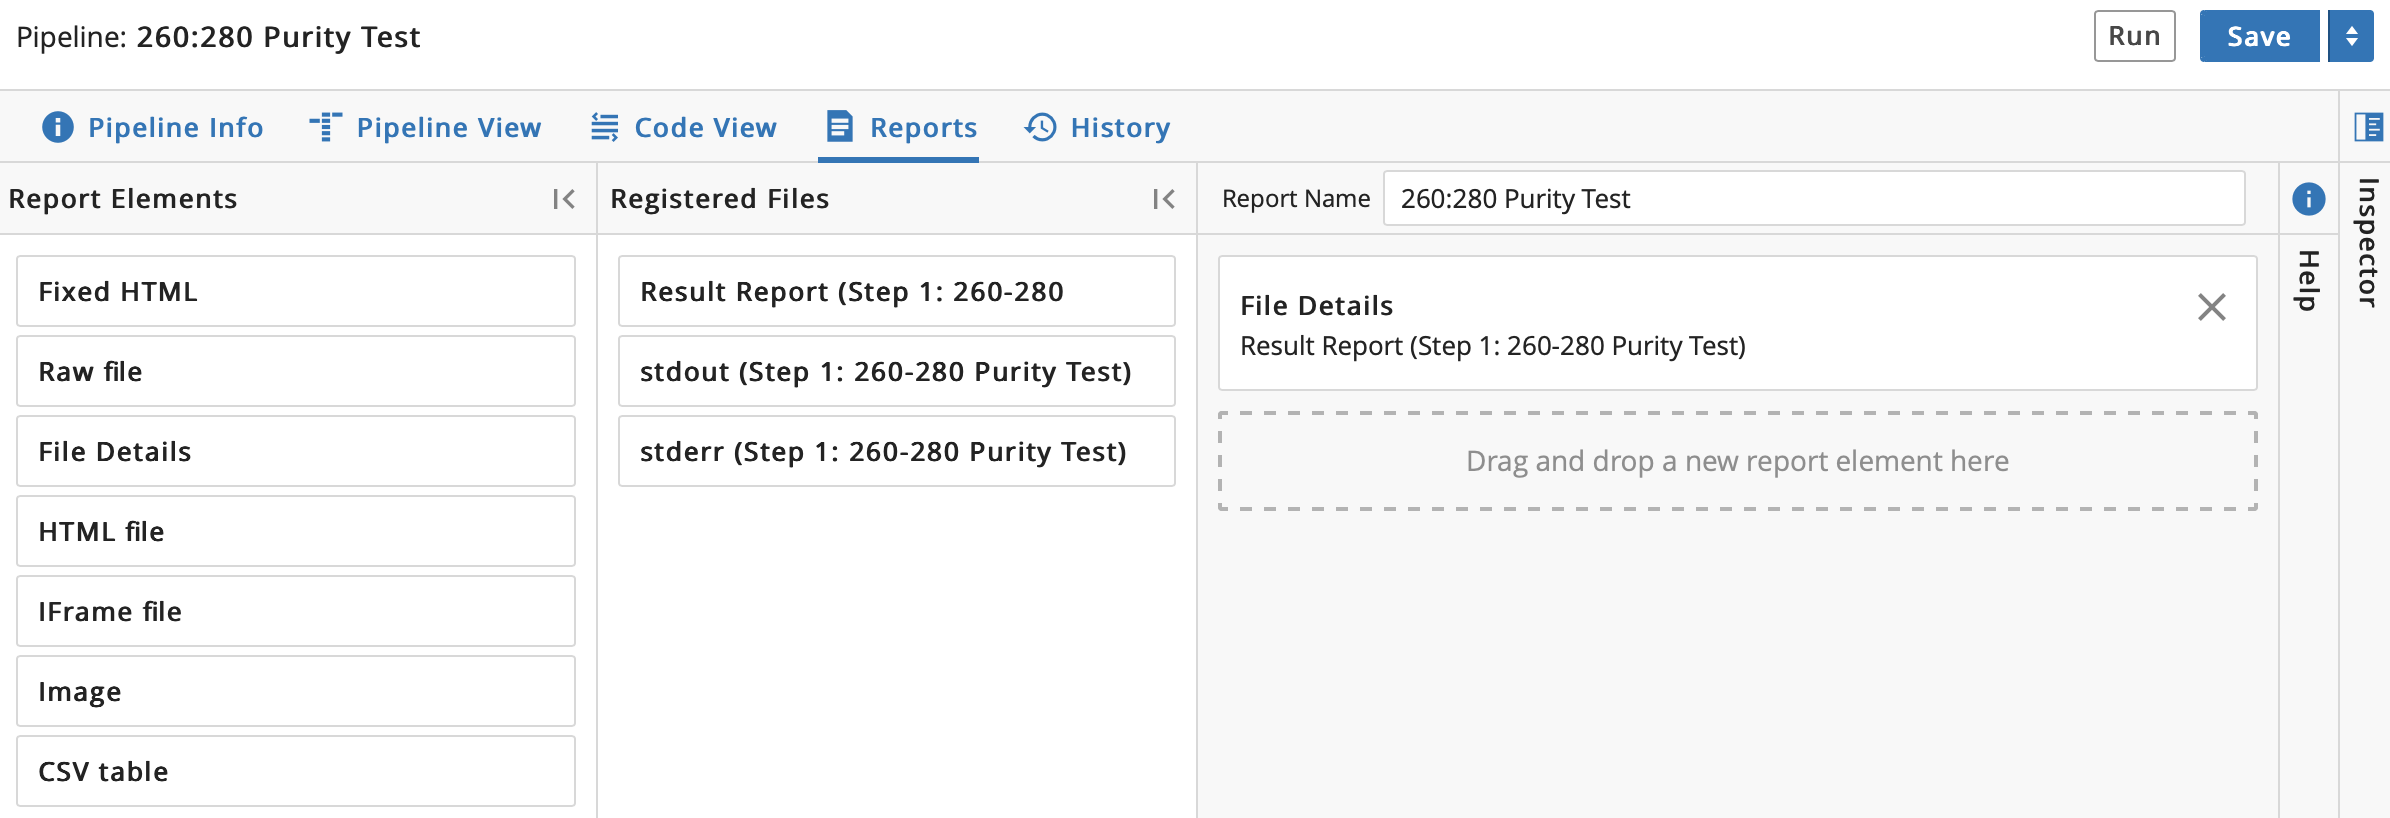
Click the Reports tab to access the Report Builder.
From the Report Elements list, drag "HTML file" to the canvas area and drop it on the Drag and drop a new report element here field.
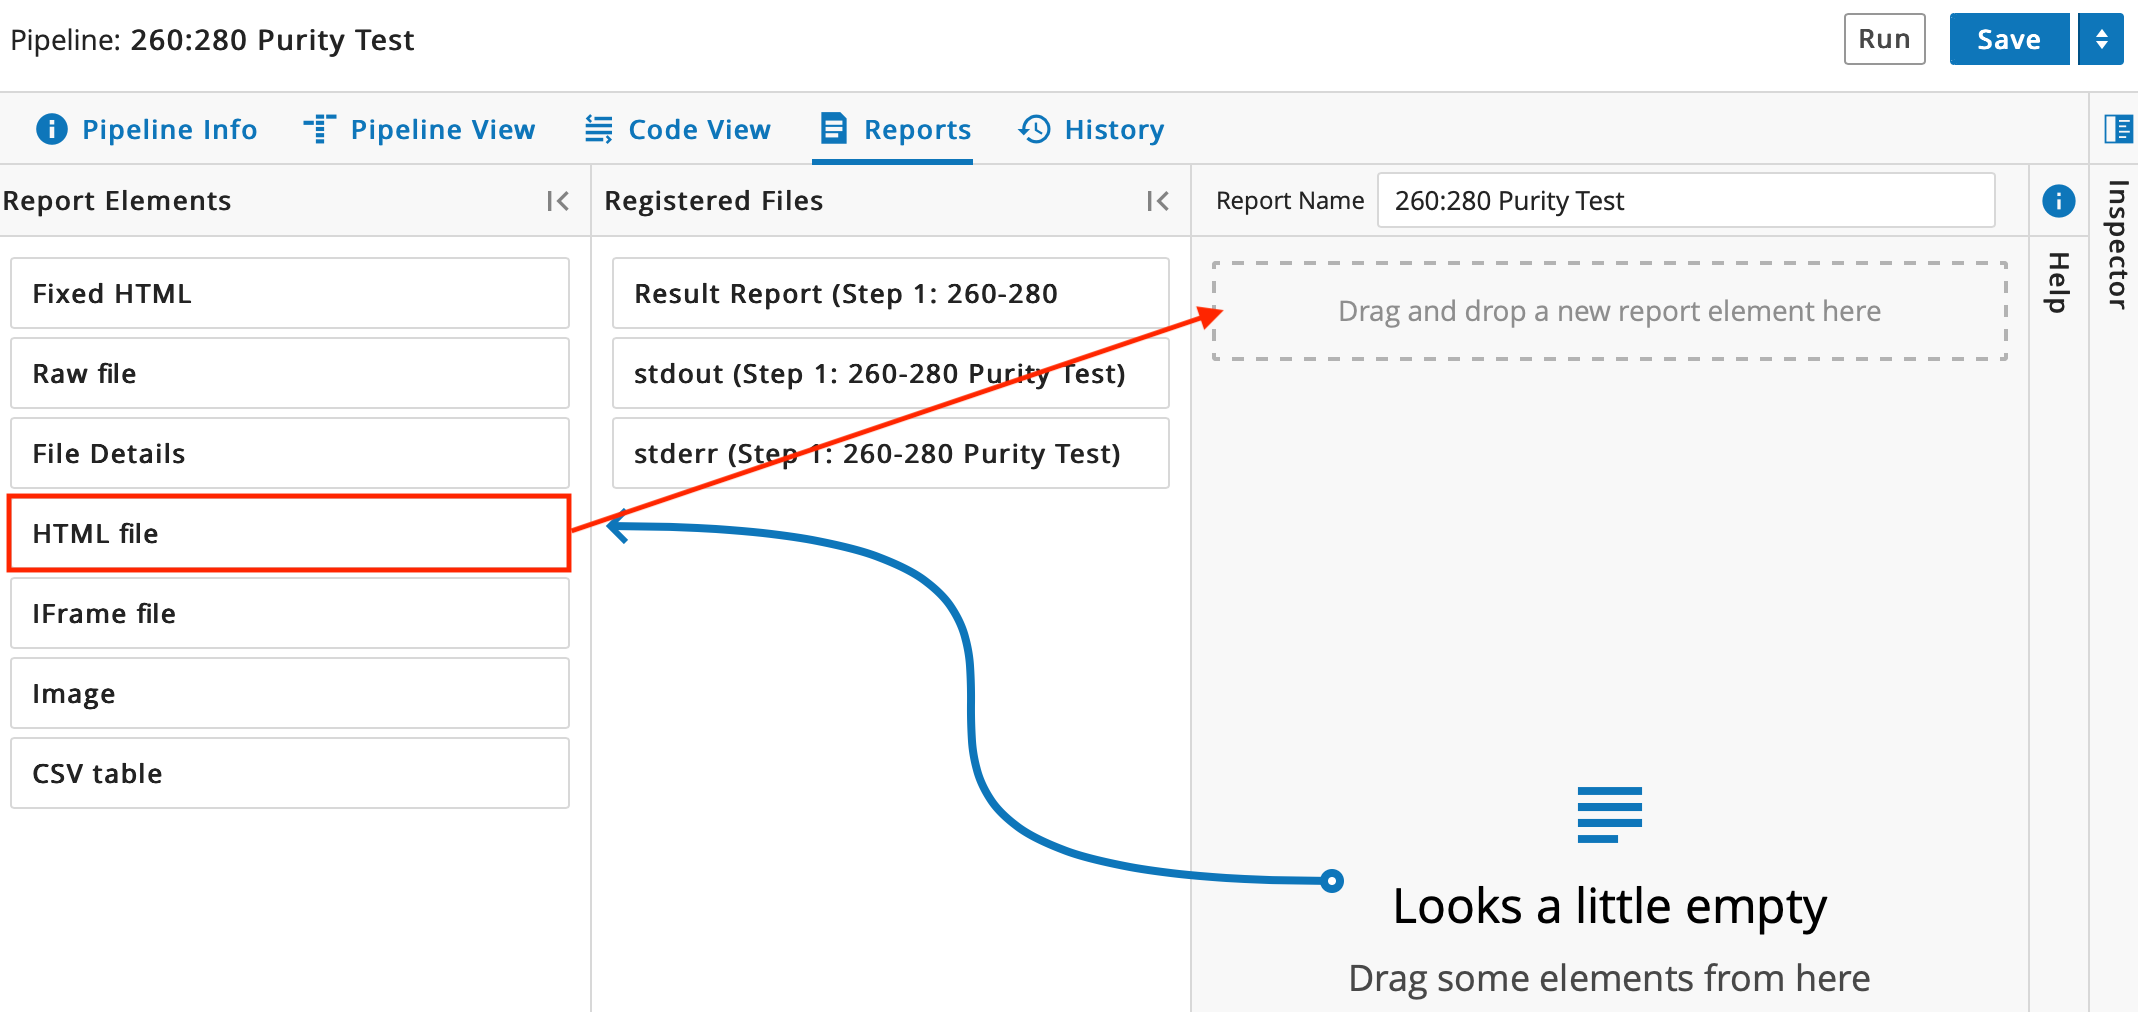
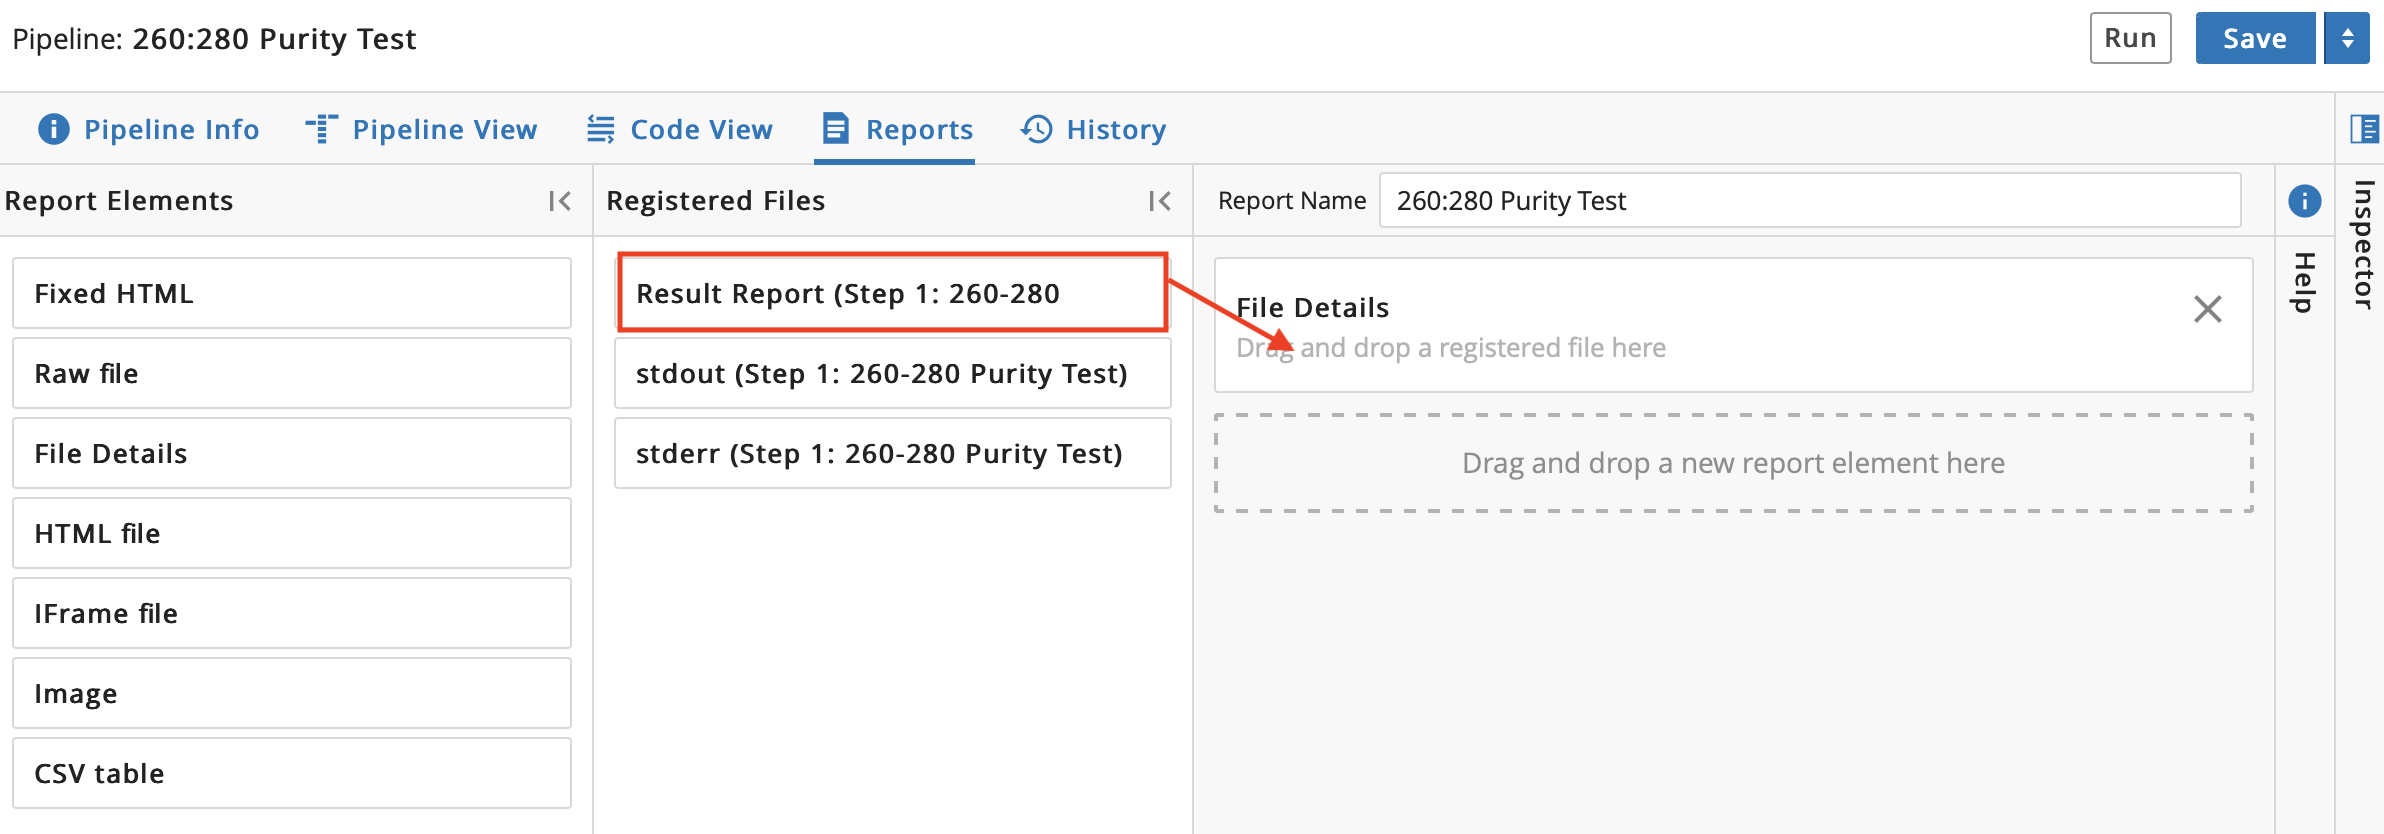
From the Registered Files list, drag "Result Report (Step 1: 260-280)" to the canvas area and drop it on the Drag and drop a registered file here field.
Click Save.
8.6.1. Test Updated Pipeline
In this section you will test the updated Pipeline in order to see the new Report.
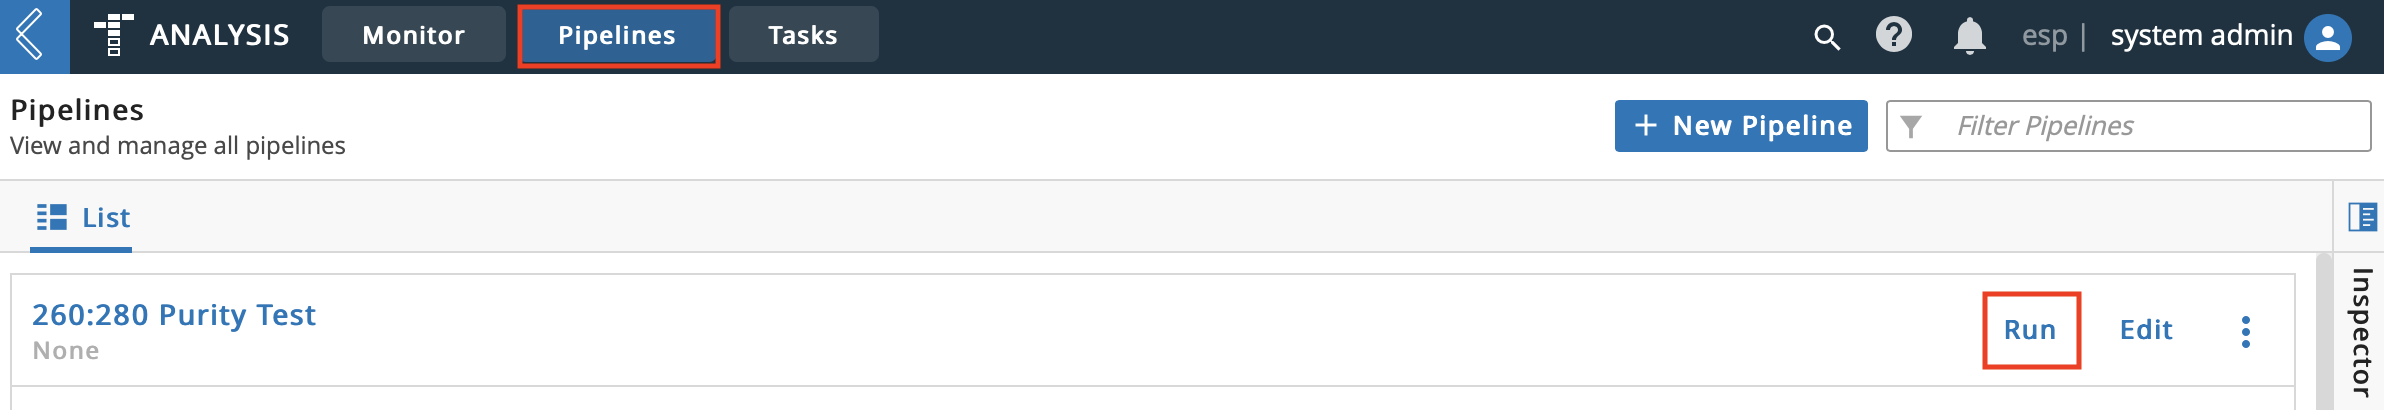
From the Analysis app, click the Pipelines tab. Click Run on the 260:280 Purity Test row.
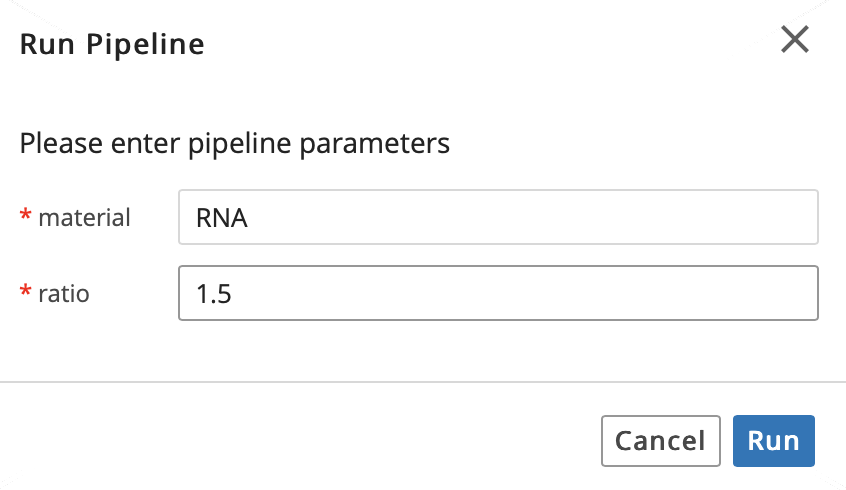
Enter "RNA" for the
materialparameter. Enter "1.5" for theratioparameter. Click Run.
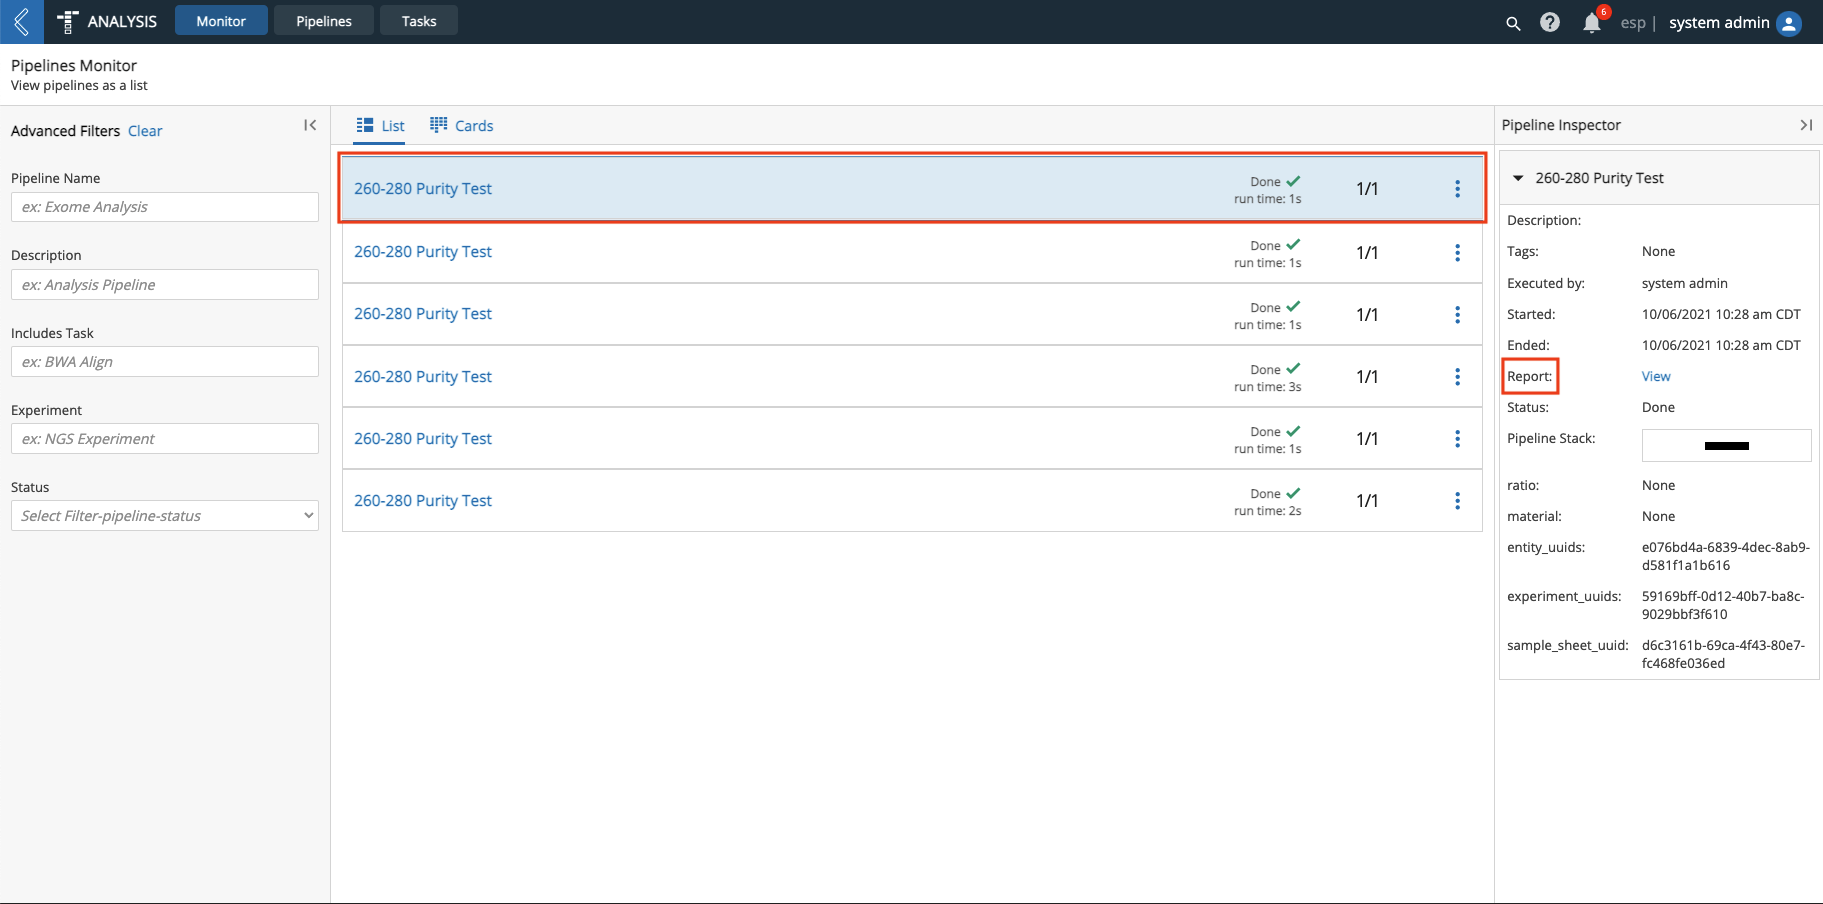
Click the Monitor tab. Click the new "260:280 Purity Test" row for the RNA/1.5 run. Click View from the Pipeline Inspector on the right to view the RNA Report. The Report shows a failed RNA Purity test.
Important
From the Monitor tab, the first run (i.e., DNA/1.9) of the 260:280 Purity Test Pipeline does not have a Report associated with it, only the Registered Files. This absence is due to how L7|ESP versions Pipelines. When a Pipeline is run, the Pipeline Instance uses the current version of the Pipeline. If the Pipeline is updated later, only new Instances of the Pipeline will incorporate those updates. Refer to Versioning System for more information.
8.7. Create Pipeline Protocol
In this section you will create a Pipeline Protocol using the Pipeline you previously created in order to feed Entity data into the L7|ESP Pipeline system for computational analysis.
Open the L7|Master app. Click Protocols from the Processes menu to access the Protocols page.
Click + New Protocol.
Enter "260:280 Report" in the Display Name field. Select No under Use in manufacturing. Select Pipeline Protocol as the Protocol Type. Select 260:280 Purity Test as the Pipeline.
Observe that two new fields appear in the Field View:
materialandratio. These two new fields are for data entry, which will later be performed by filling out a Worksheet in the LIMS app.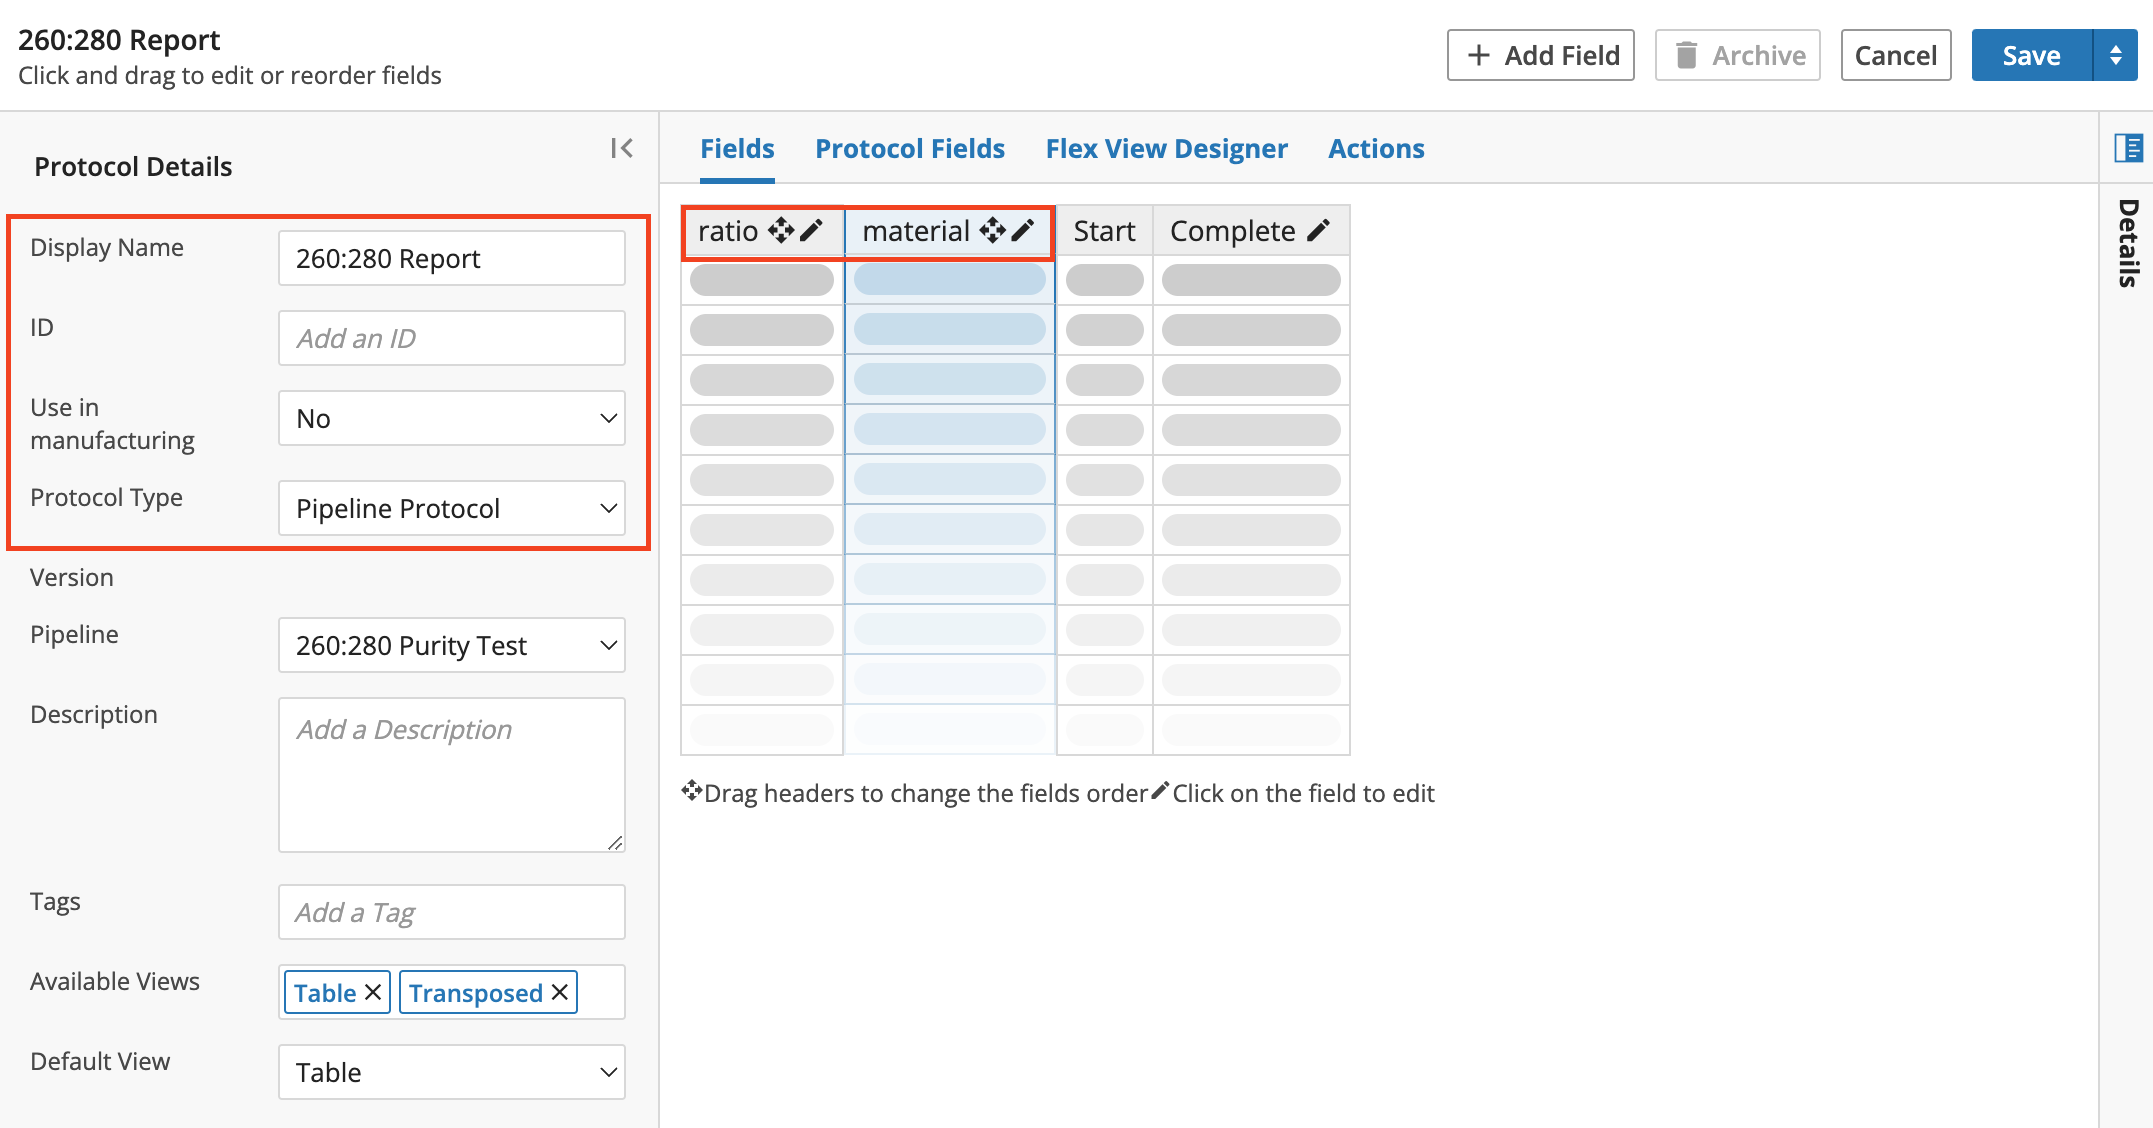
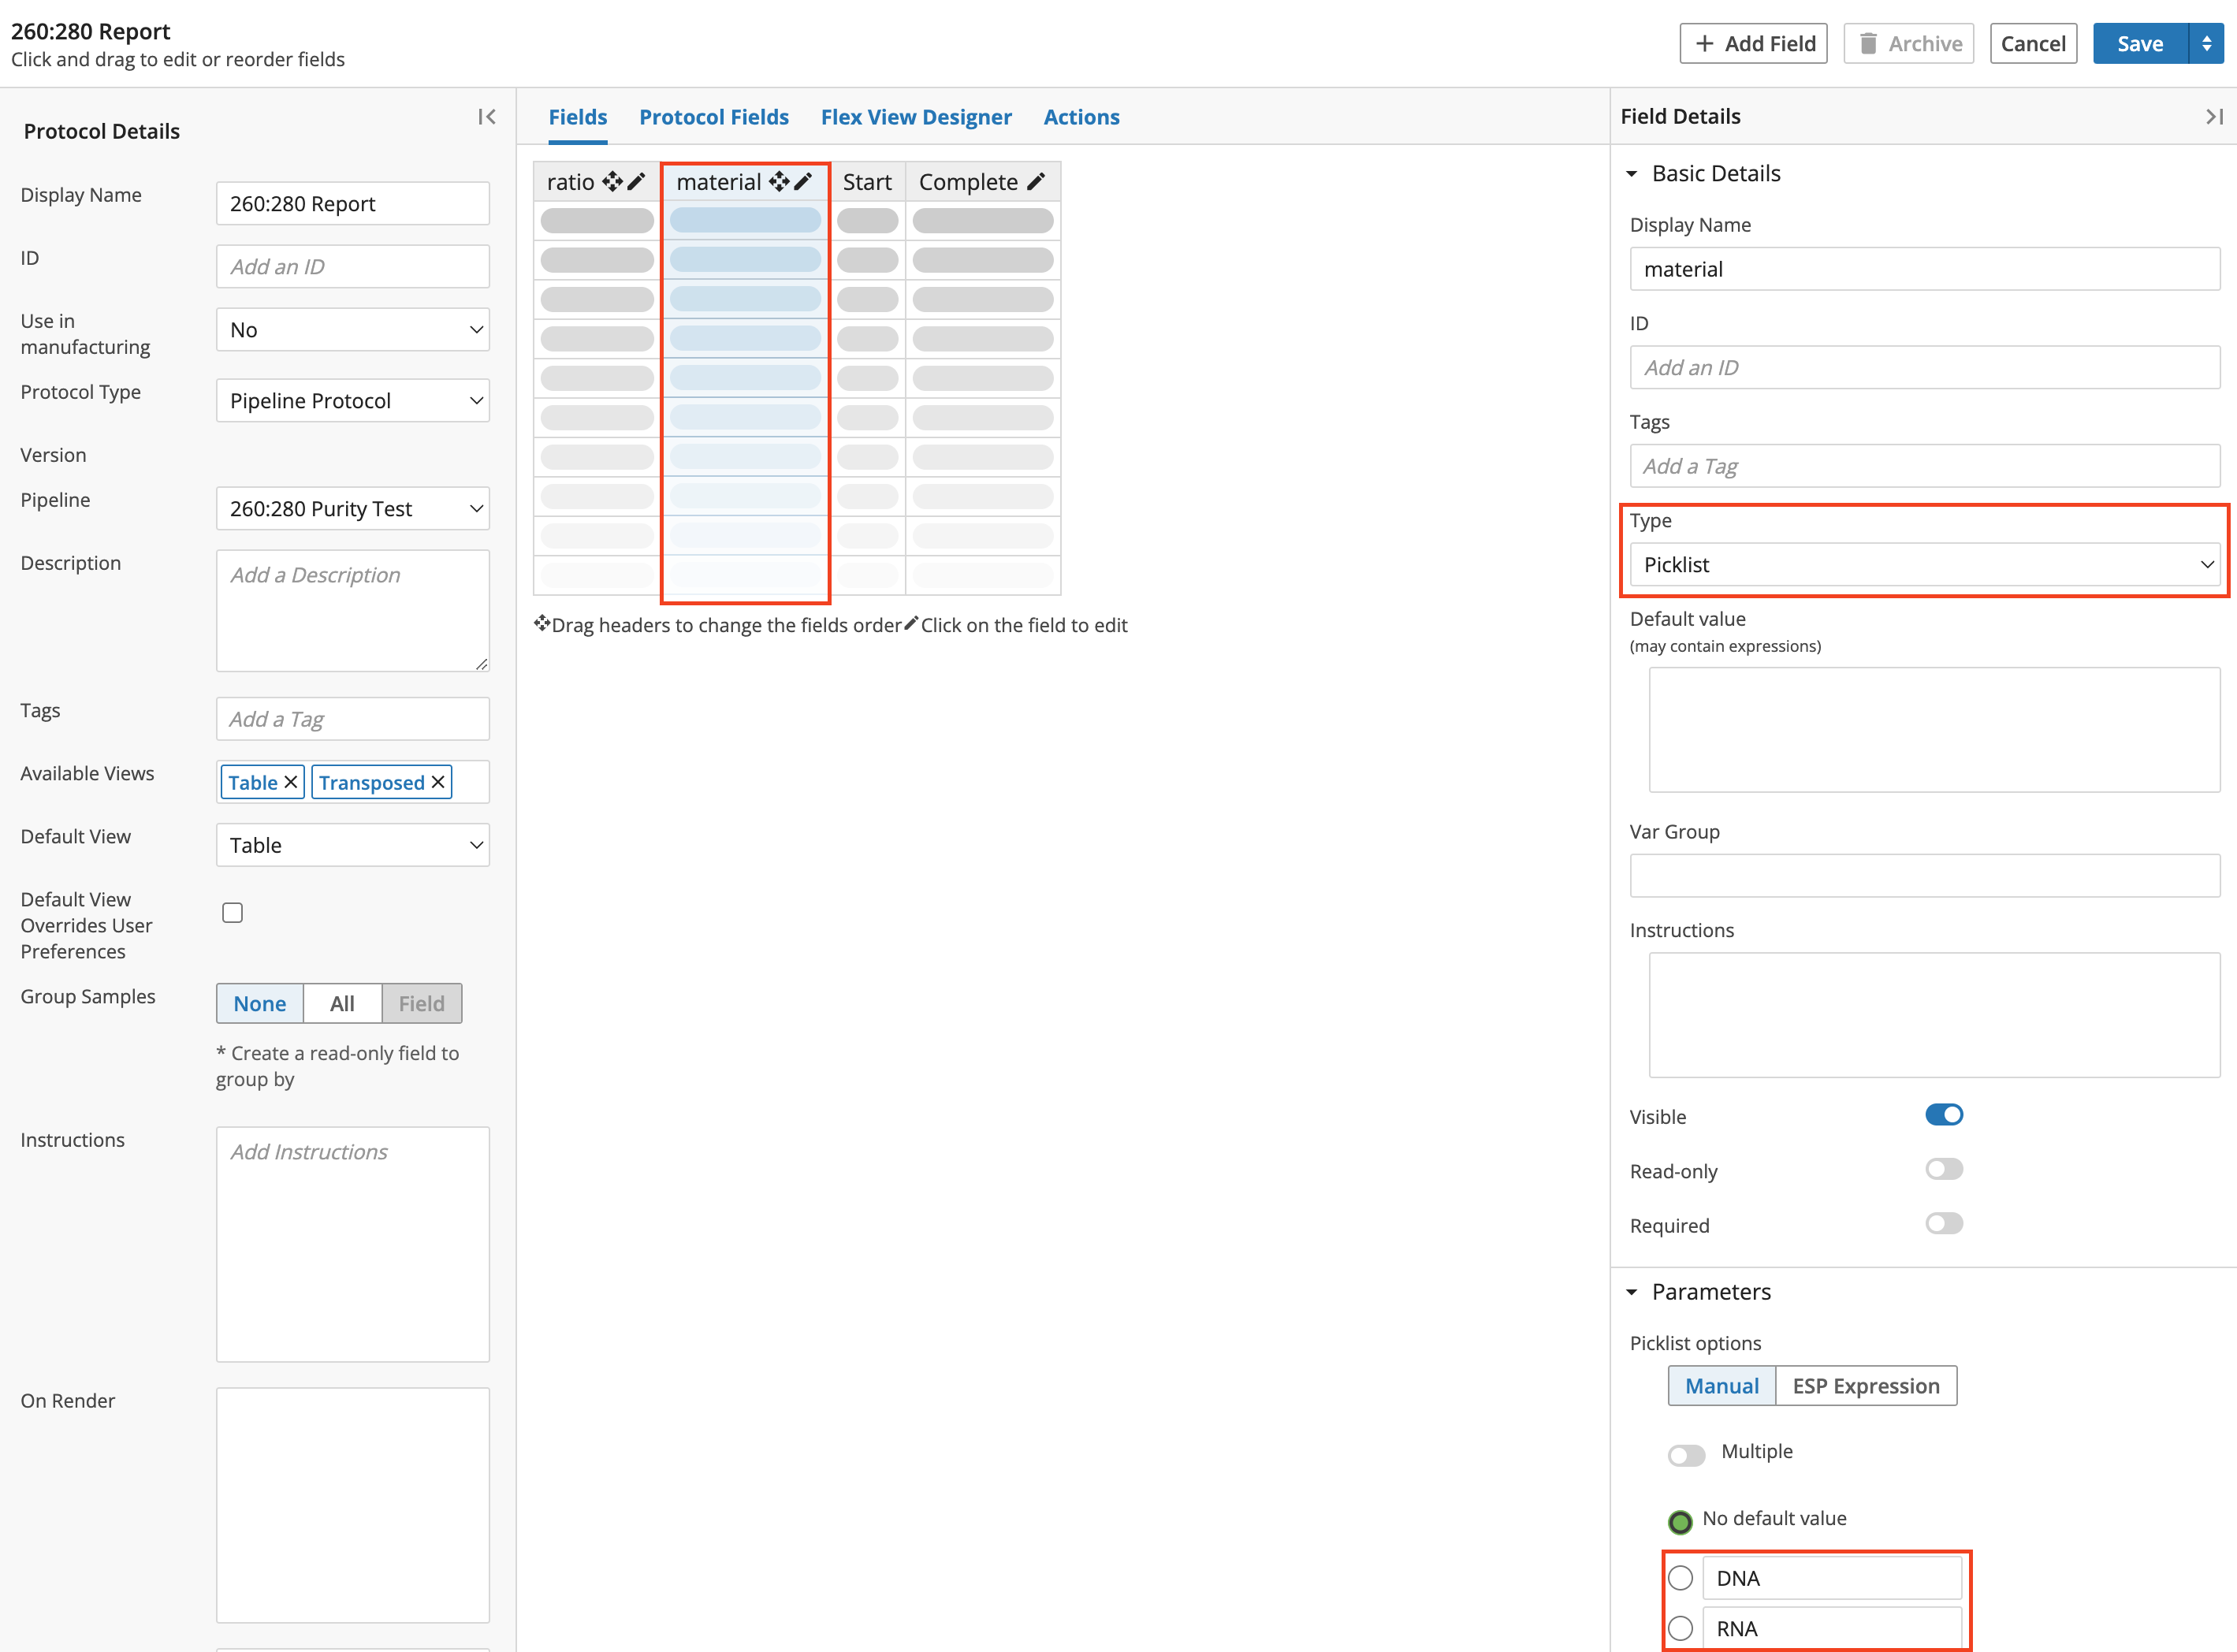
Click anywhere in the
materialfield. Thematerialfield will be highlighted in blue. In the Field Details panel, select Picklist as the Type. Expand the Parameters section and enter "DNA" in the Enter option 0 field. Enter "RNA" in the Enter option 1 field.
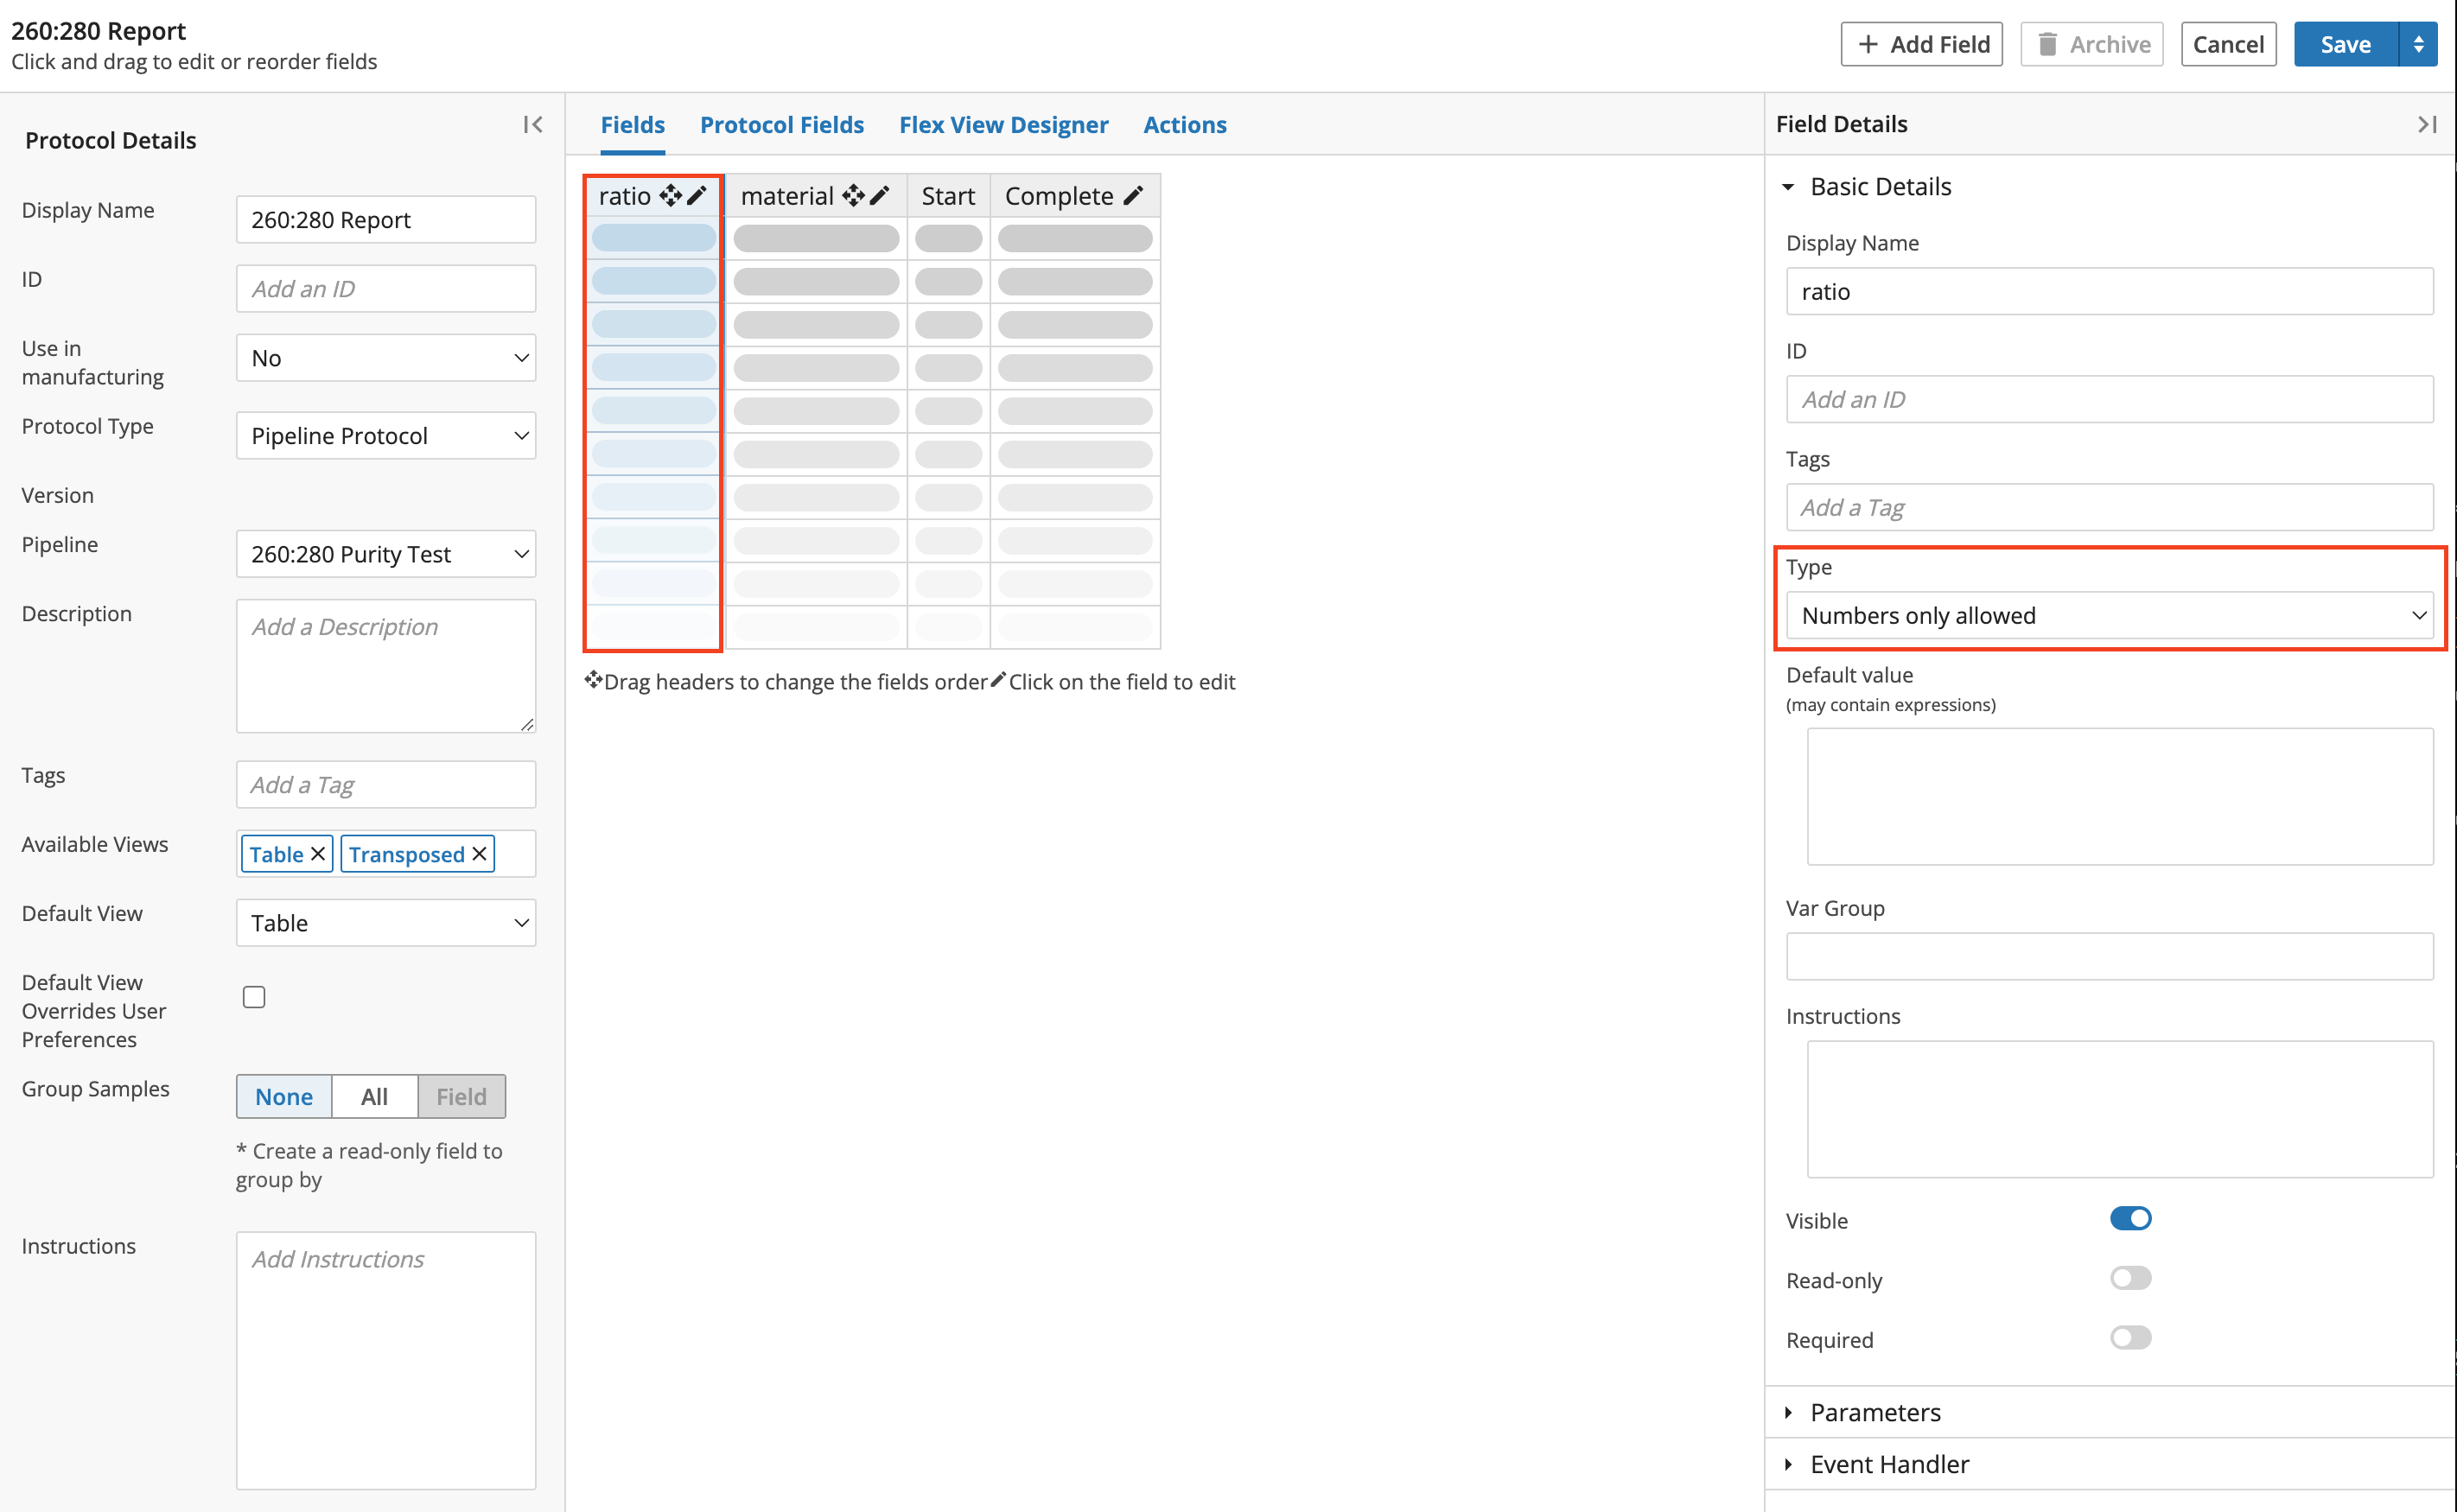
Click anywhere in the
ratiofield. Now theratiofield will be highlighted in blue. In the Field Details panel, select Numbers only allowed as the Type.
Click Save.
You have now created a Standard Protocol and Pipeline Protocol, which will be used to create a Workflow.
8.8. Create Workflow
In this section you will create a simple quality control Workflow that determines the purity of a DNA or RNA Entity using the 260:280 spectrophotometric ratio. The image below shows that this Workflow will have two Protocols: a Standard Protocol to collect the 260:280 ratio and a Pipeline Protocol to generate a quality control Report.
Note
Workflow building is usually done by L7 Informatics during a customer's preliminary setup period; however, after following this section you will have the knowledge to create Workflows on your own, at any time.
Open the L7|Master app. Click Workflows from the Processes menu.
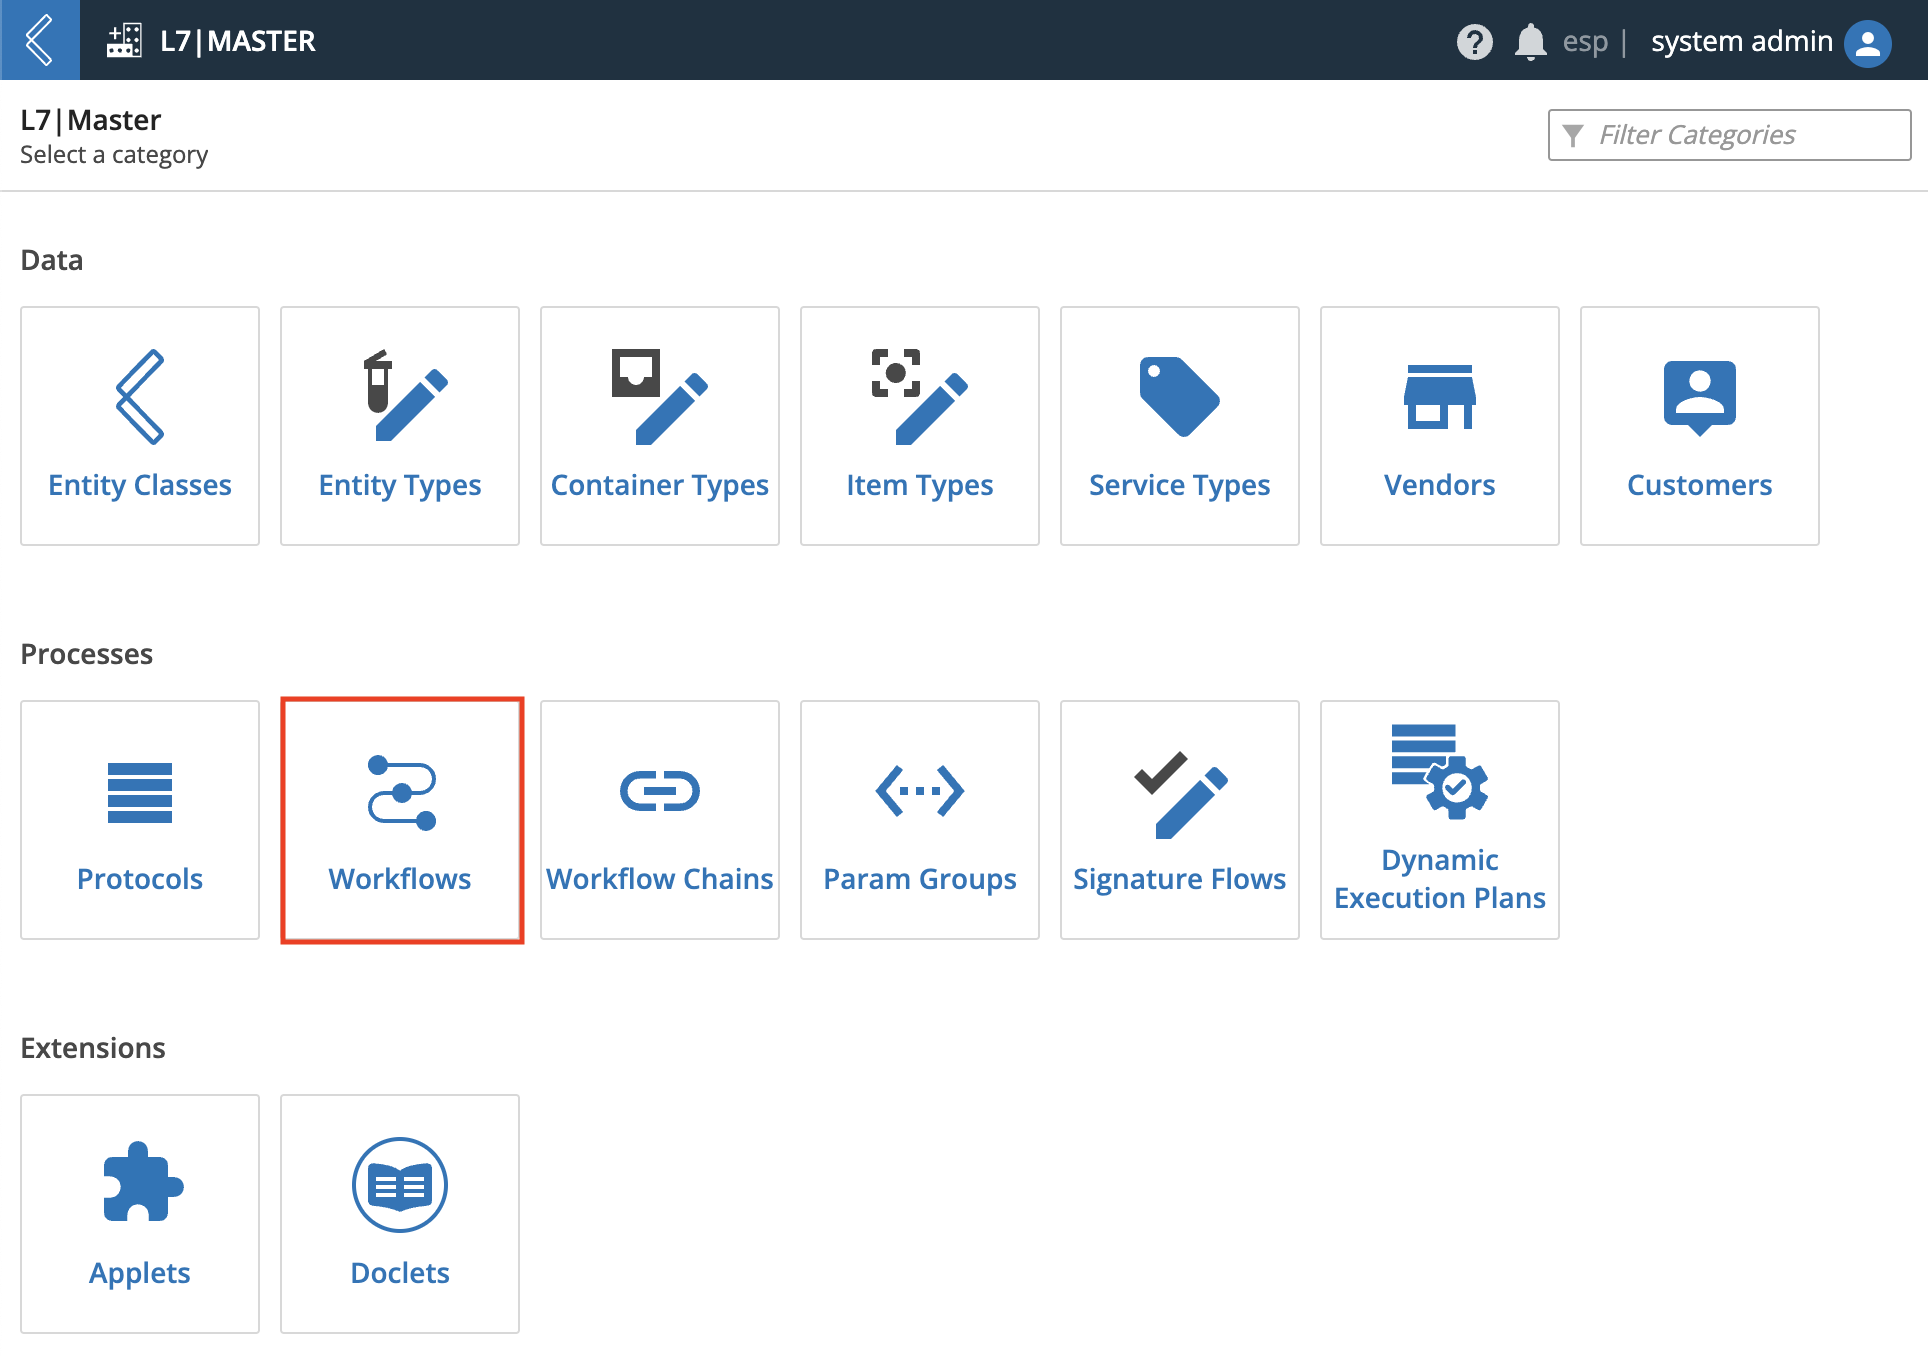
Click + New Workflow.

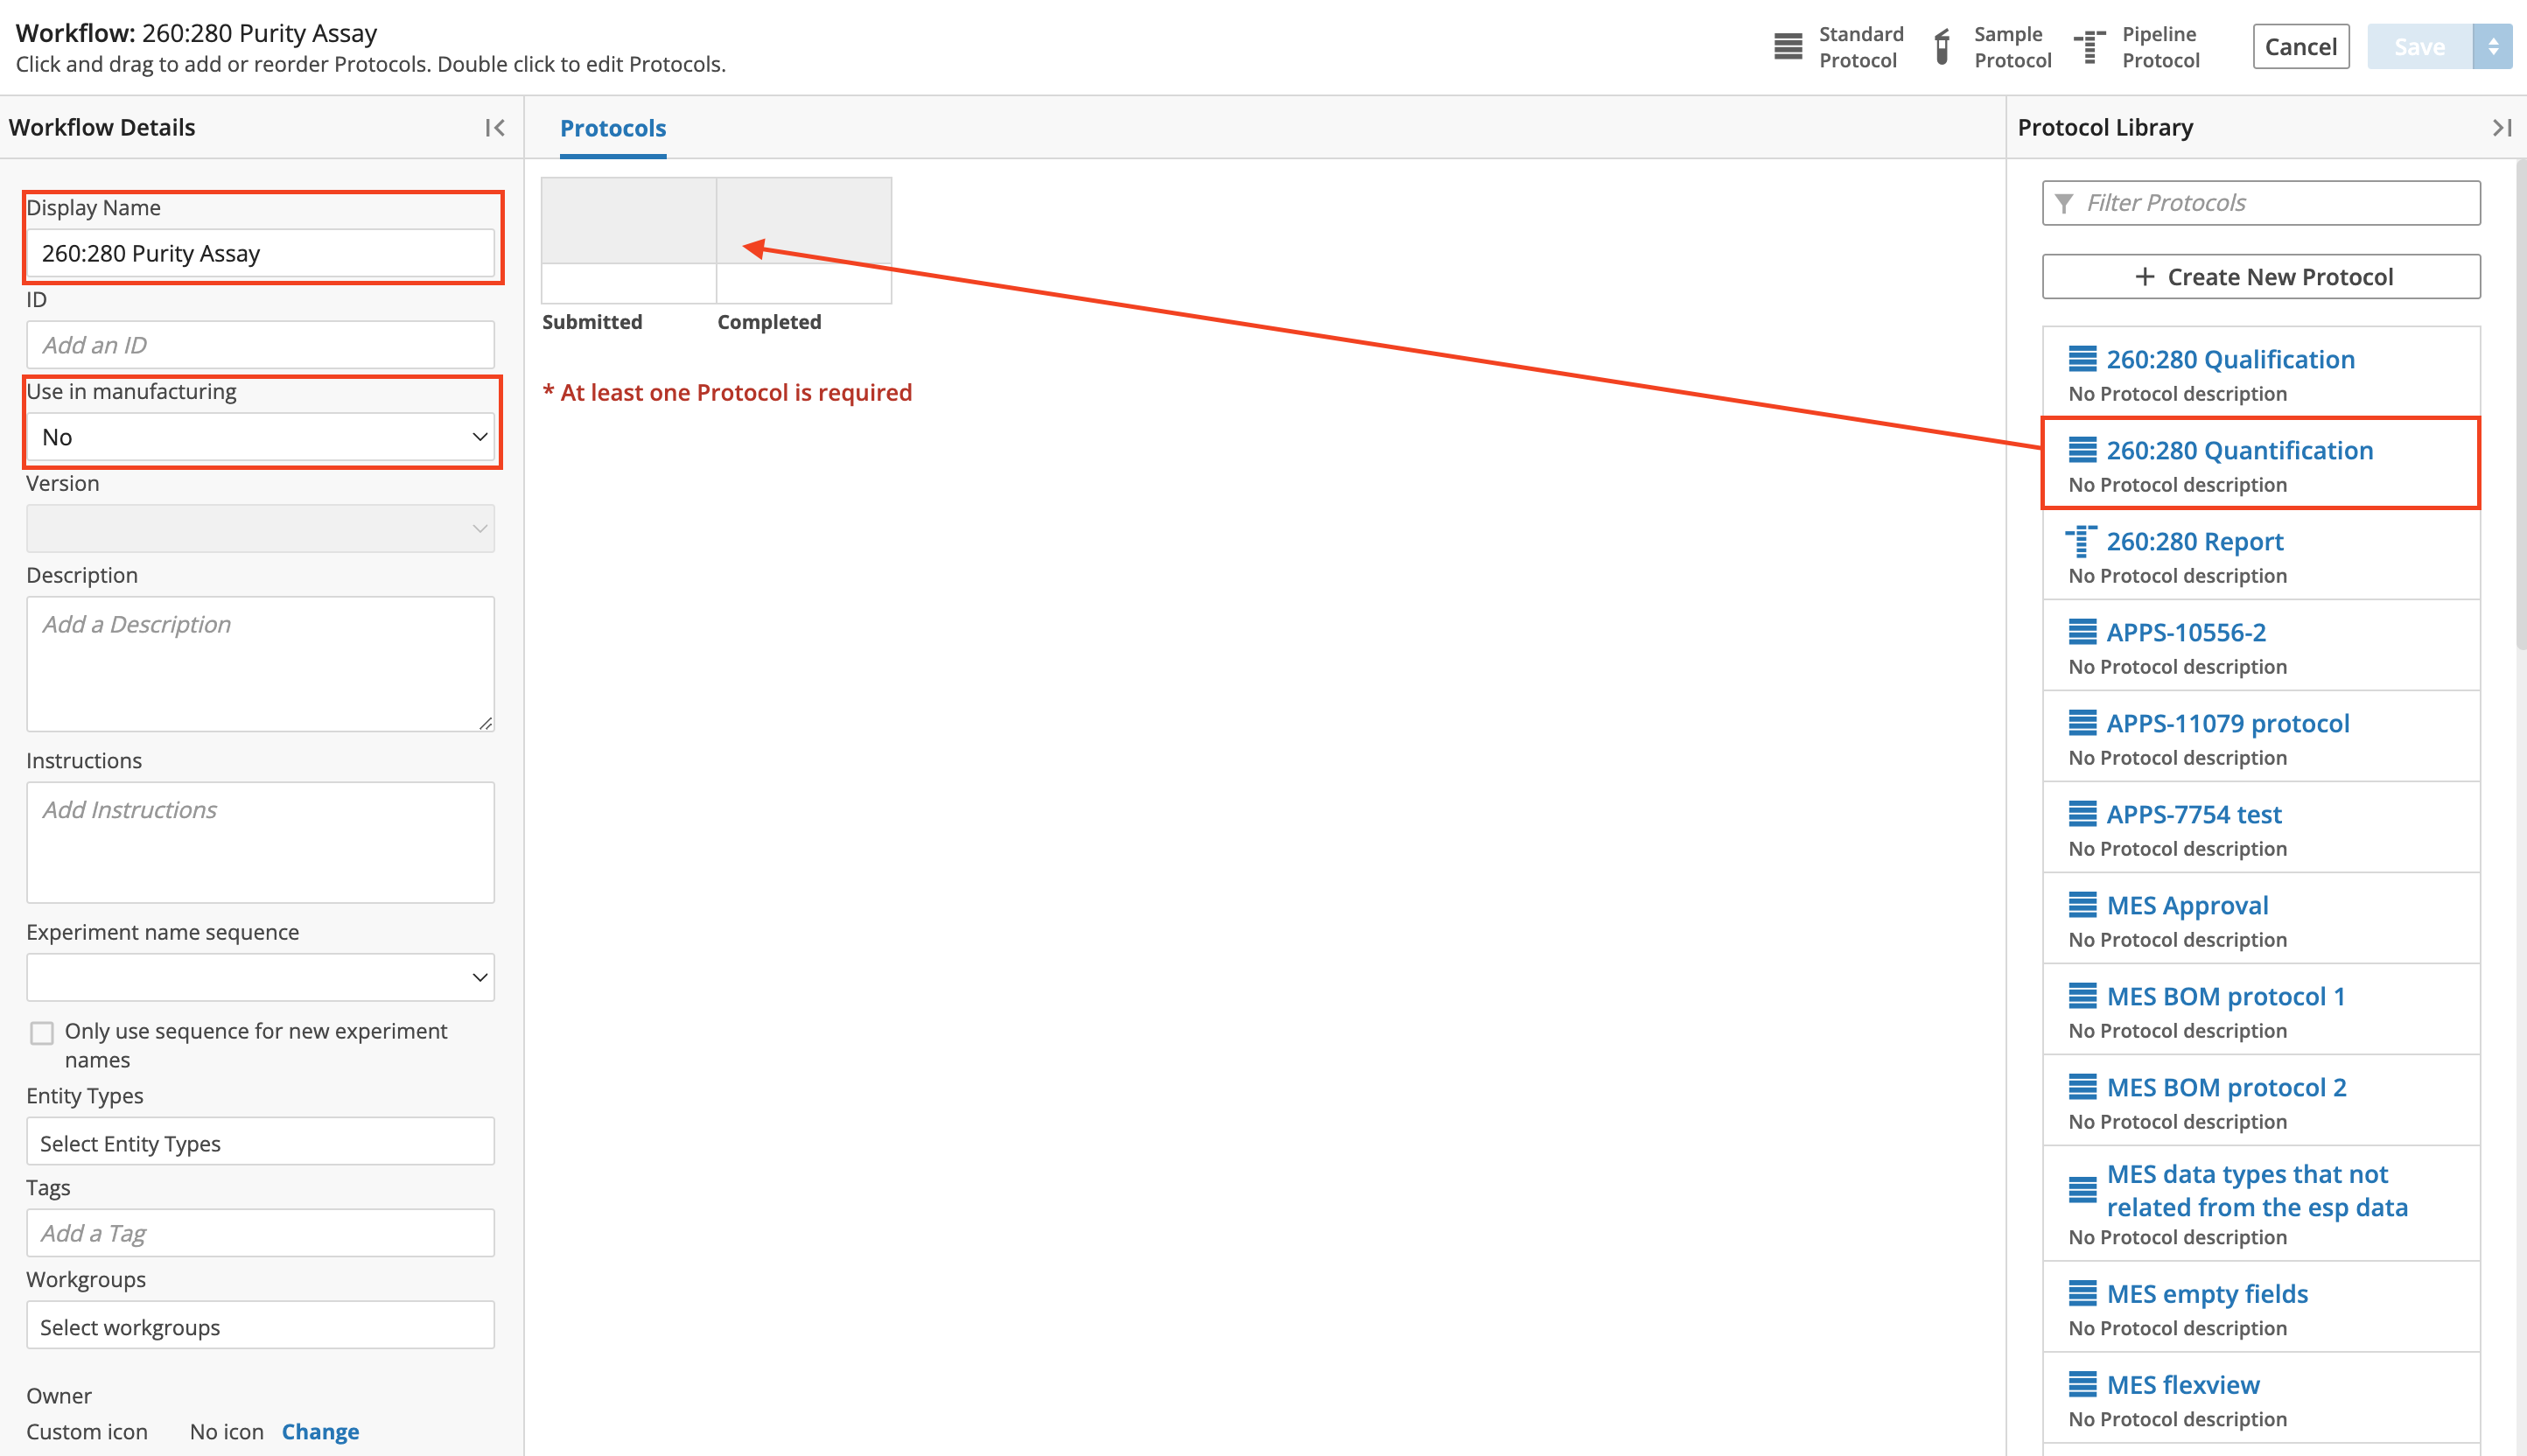
Enter "260:280 Purity Assay" in the Display Name field. Select No under Use in manufacturing.Click and drag the 260:280 Quantification (from the Protocol Library panel) and drop in between the default Submitted and Completed boxes.
Note
The Submitted and Completed boxes are not Protocols or data entry fields - they are visual aids to display the status and quantity of an Entity Set as the individual Entities move through an Experiment. Specifically, the Submitted box displays the quantity of Entities submitted to a Workflow and the Completed box displays the quantity of Entities that have advanced through the entire Workflow.
Click and drag the 260:280 Report (from the Protocol Library panel) and drop in between the 260:280 Quantification Protocol and the default Completed box.
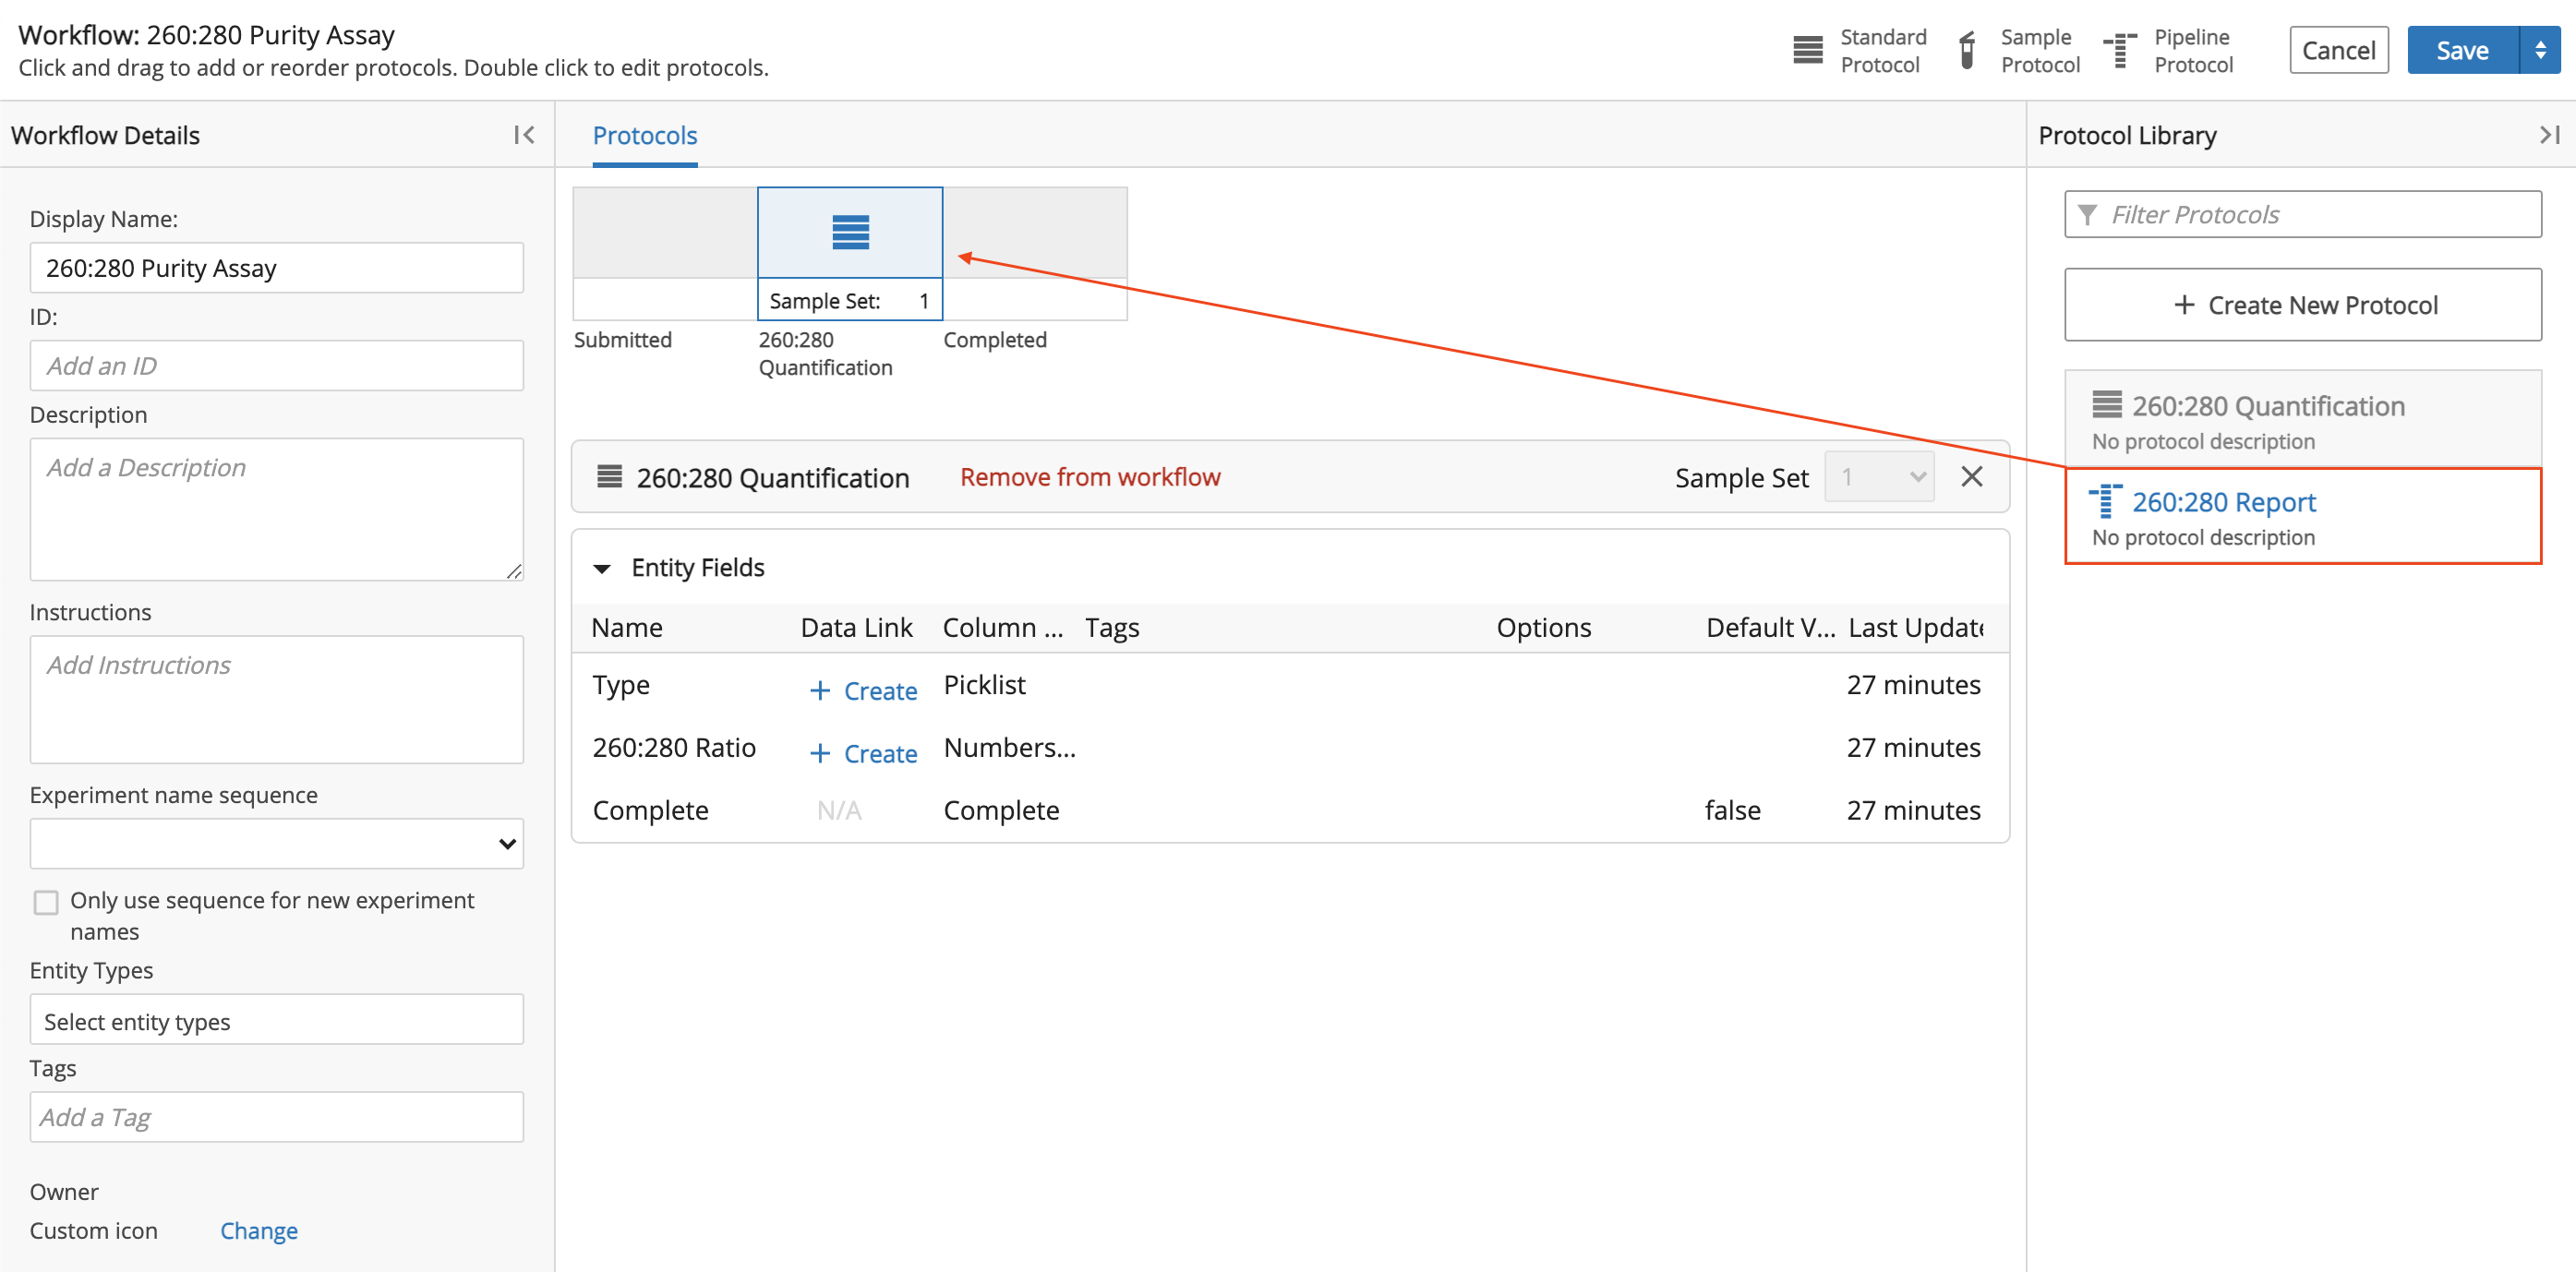
Click Save.
8.9. Create Project
In this section, you will create a Project. A Project is a collection of Experiments, grouped together for organizational purposes. You must create a Project before creating an Experiment.
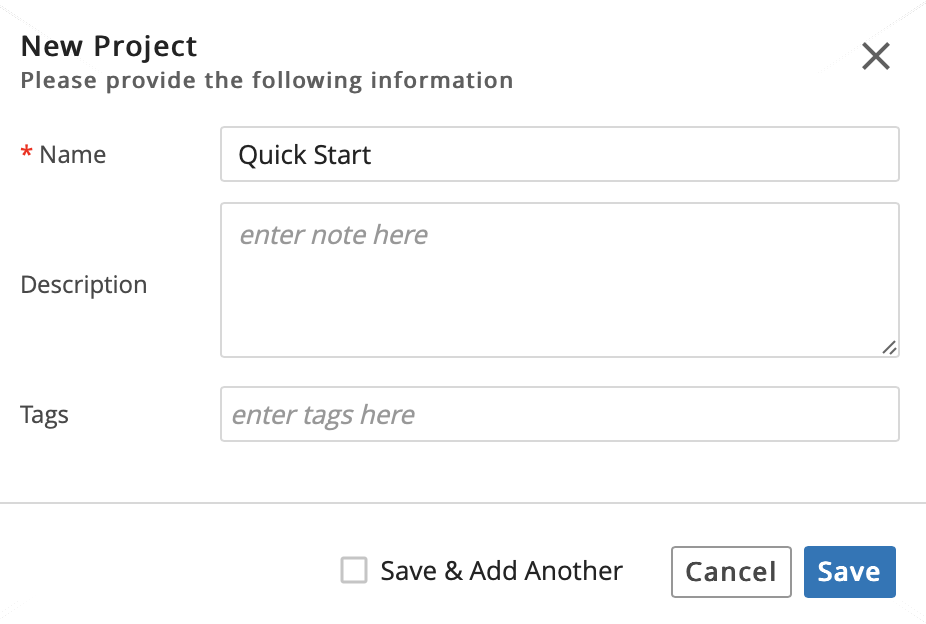
Open the Projects app. Click + New Project.
Enter the Project name as "Quick Start."
Click Save.
8.10. Create Experiment
In this section you will create an Experiment, add the Experiment to the Project you previously created, and add/submit Entities to the Experiment.
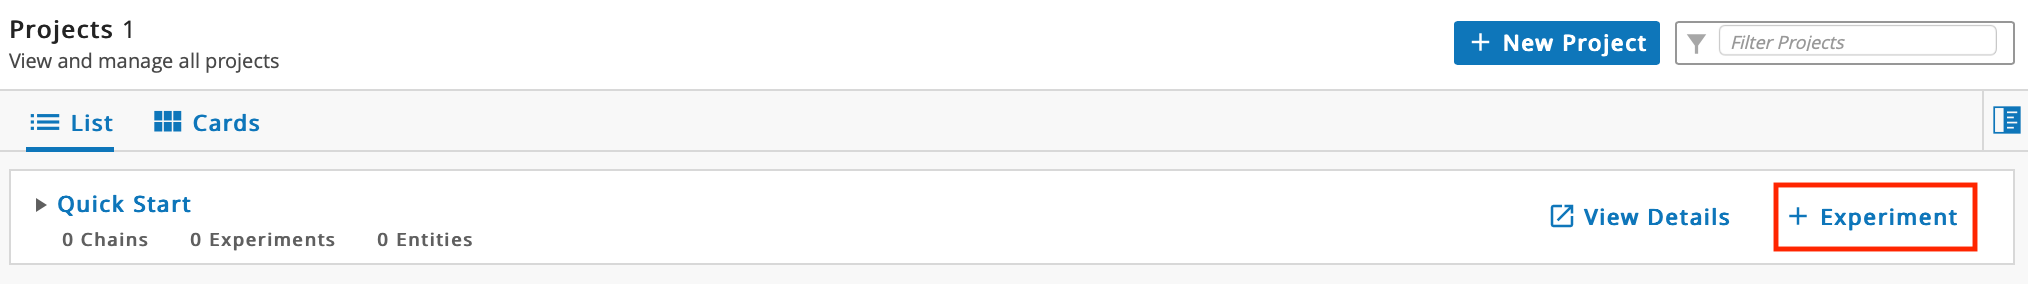
On the row of the Quick Start Project you just created, click + Experiment.
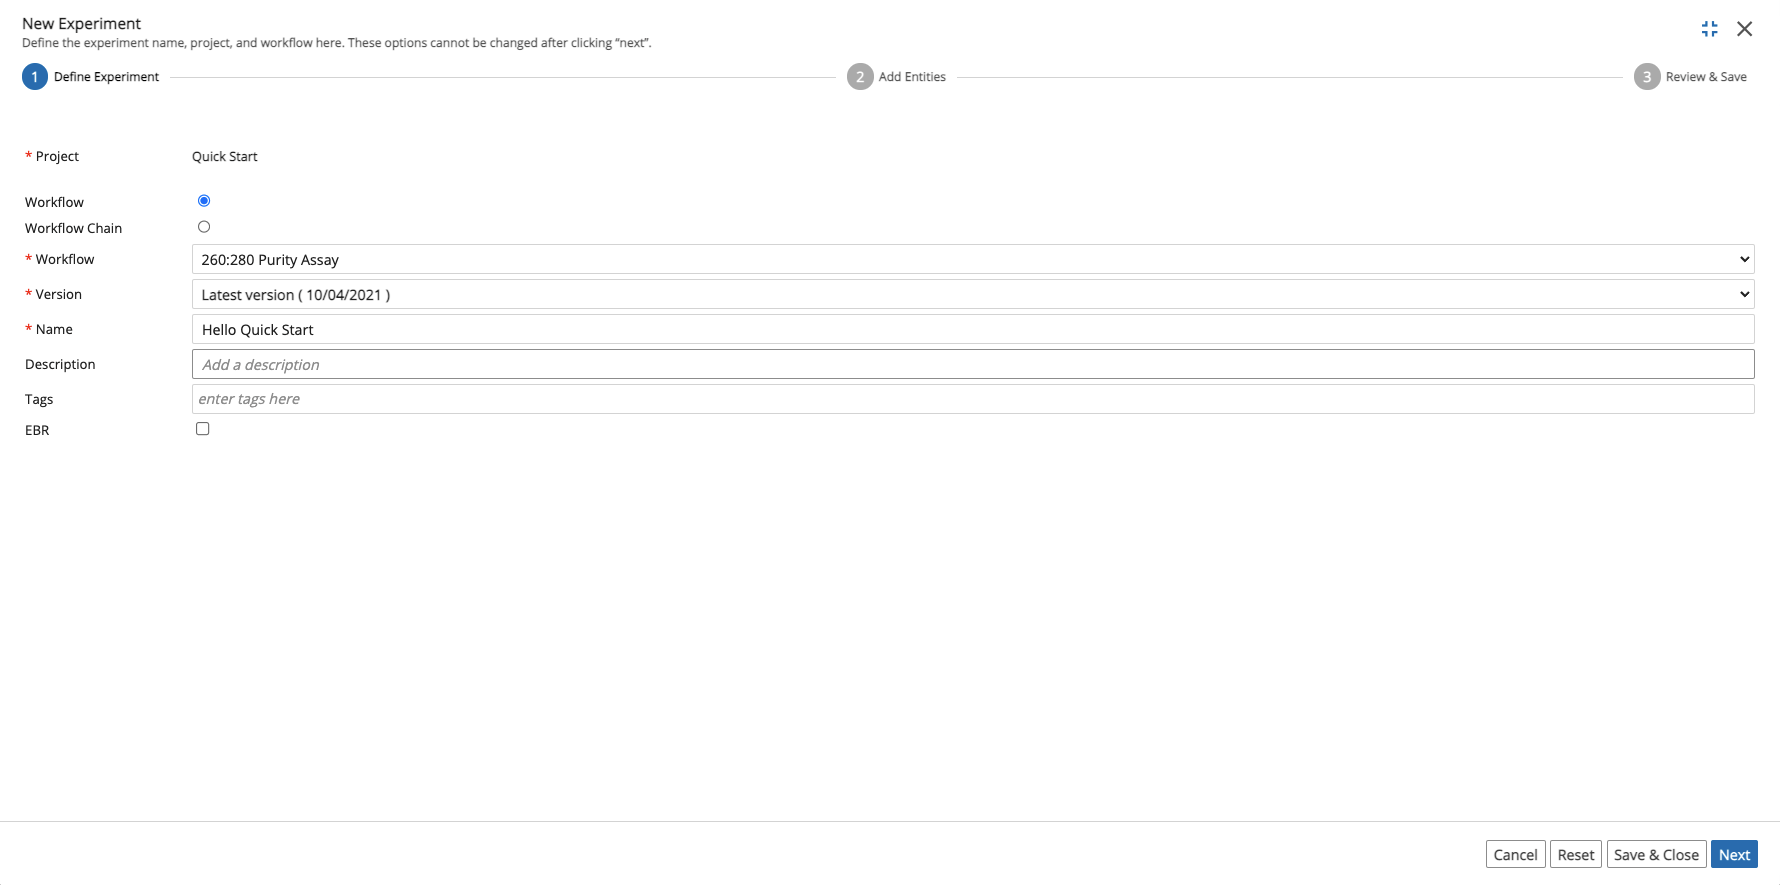
Verify that Workflow is selected. Select 260:280 Purity Assay from the Workflow drop-down. Enter "Hello Quick Start" as the Name. Click Next.
Click Add New Entities. Select Generic sample from the Entity Type drop-down. Enter "4" in the Number of Entities field. Verify that ESP SEQUENCE is selected from the Entity ID Sequence drop-down. Click Next.
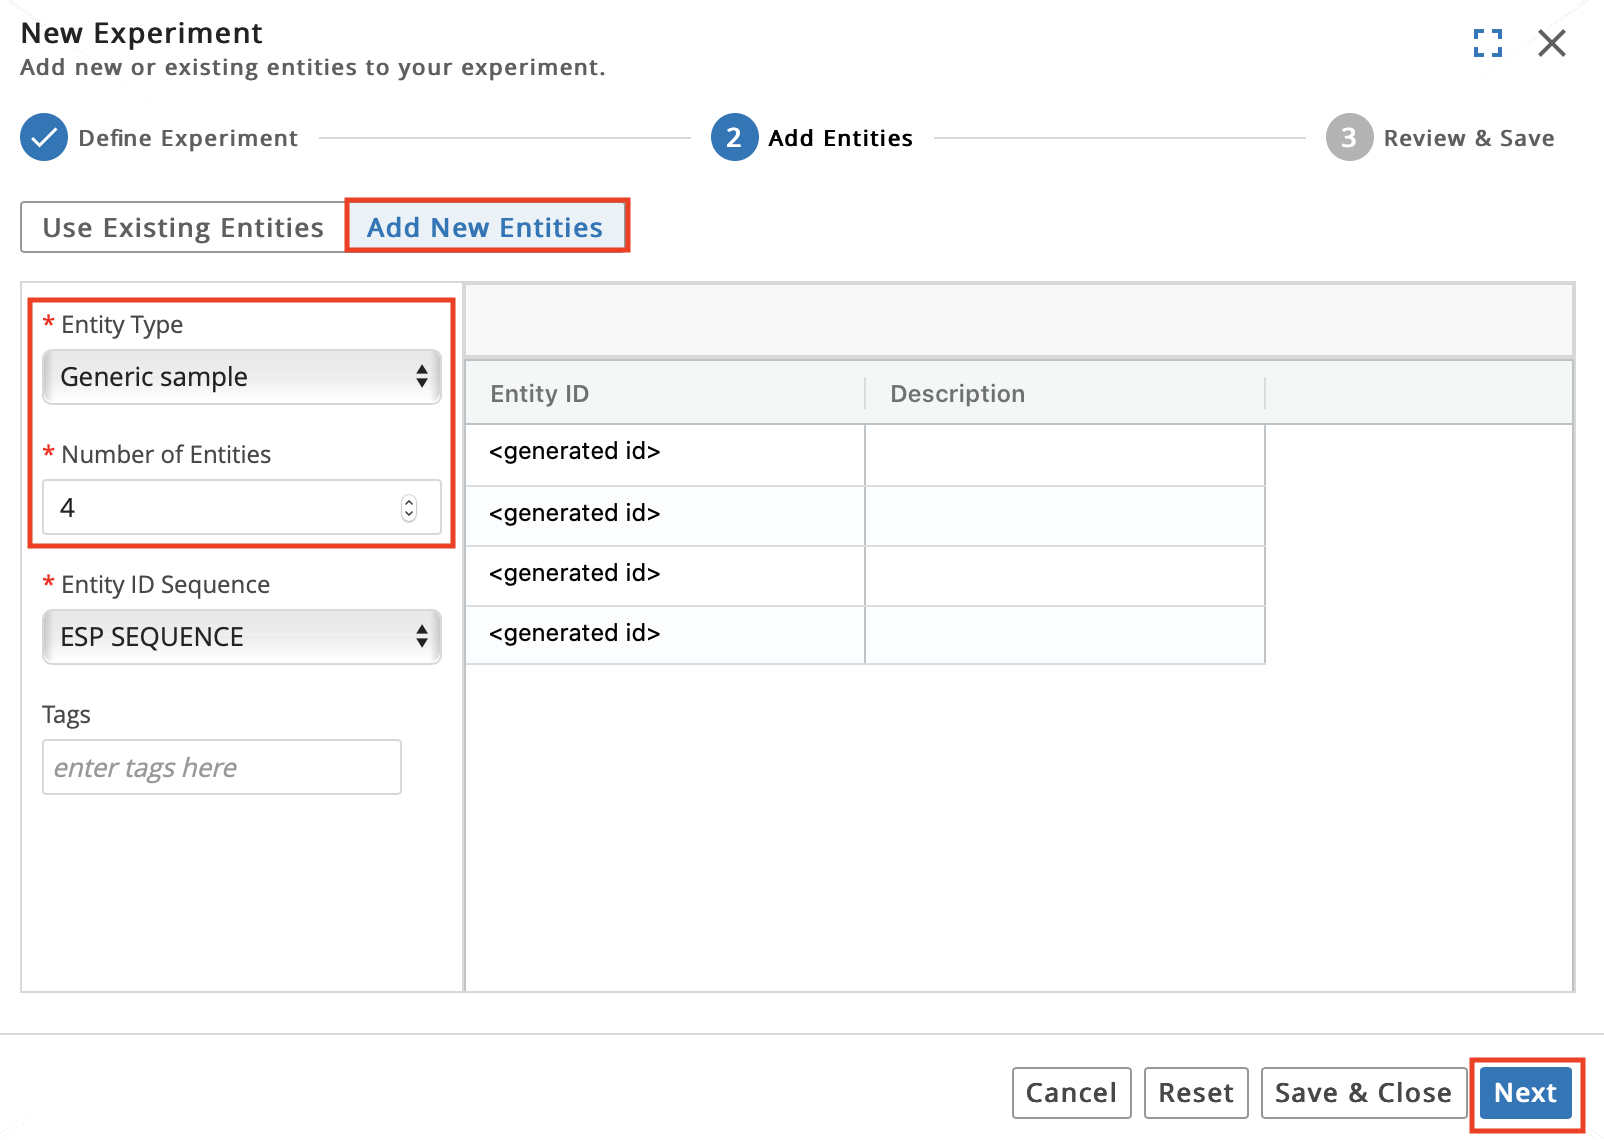
Note
Entity ID Sequence is used to generate Entity names automatically as Entities are added.
Check the box to the left of Entity ID to select all 4 Entities. Click Save and Submit.
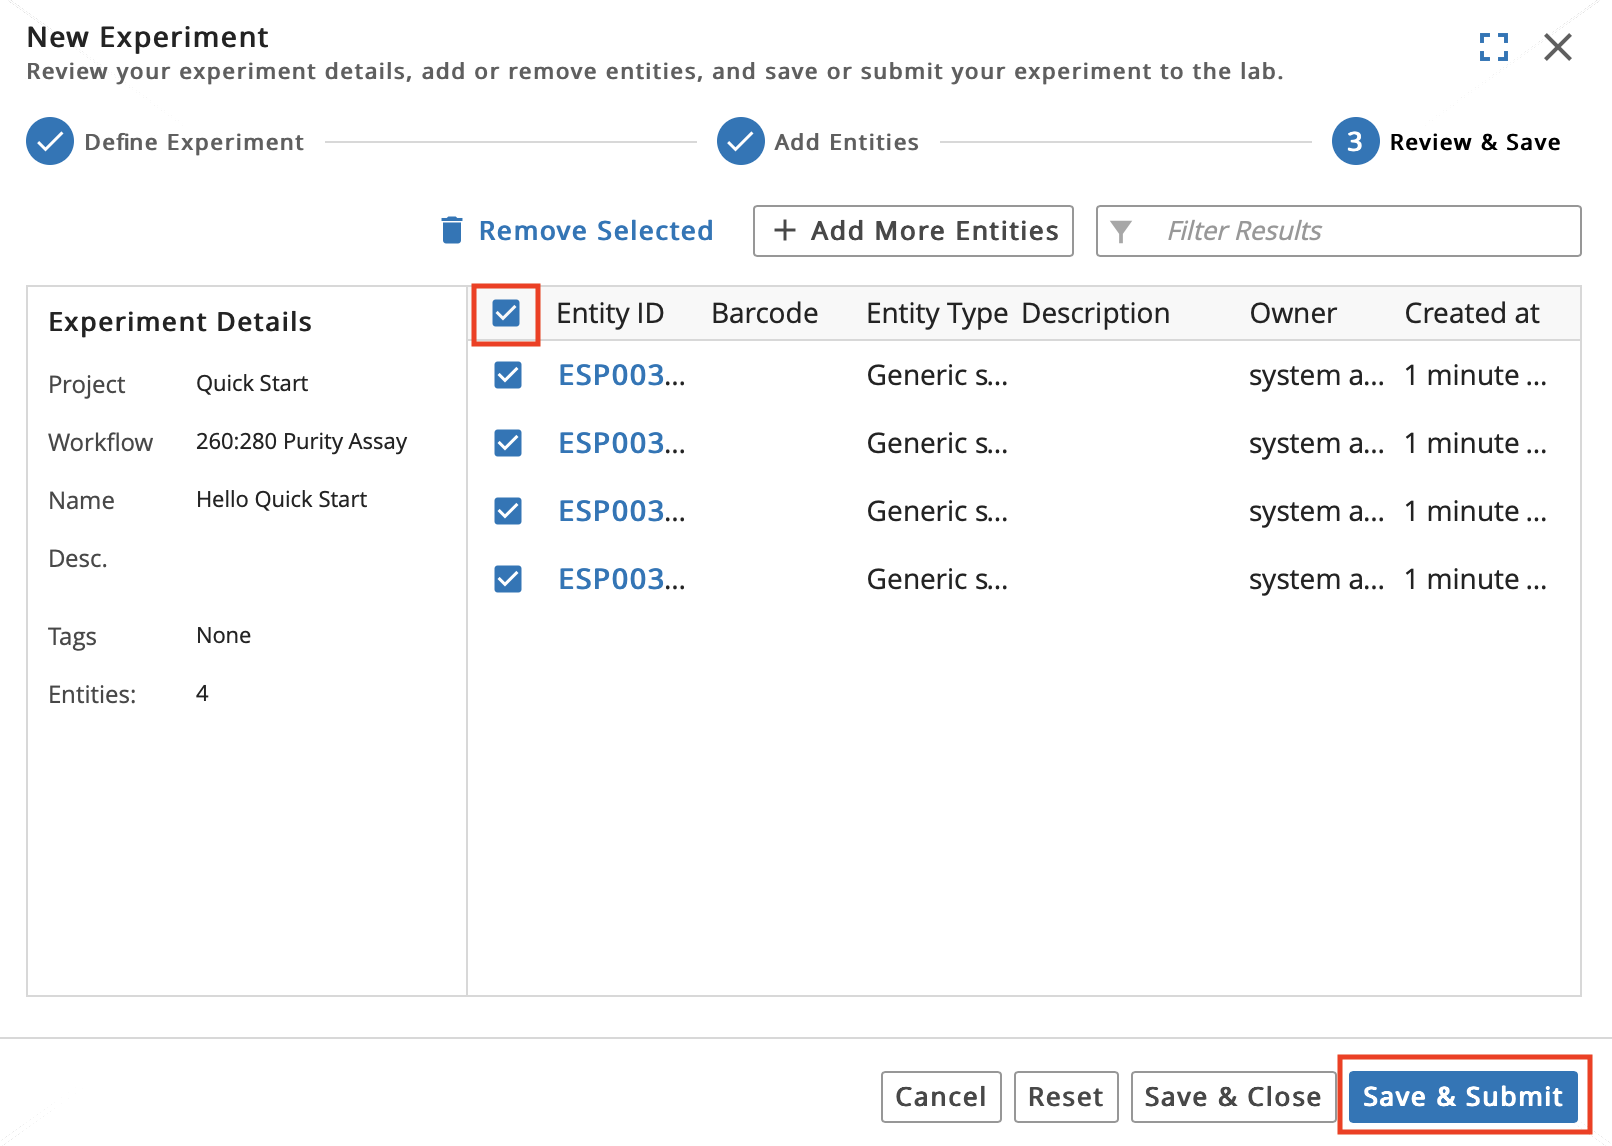
Click Submit Entities in the Submit Confirmation dialog.
The Experiment (with four Entities) has been submitted to the LIMS app.
8.11. Create Worksheet and Add Entities
In this section you will create a Worksheet and add the Entities from the Experiment you previously created to the Worksheet. This Worksheet will later be used for data entry.
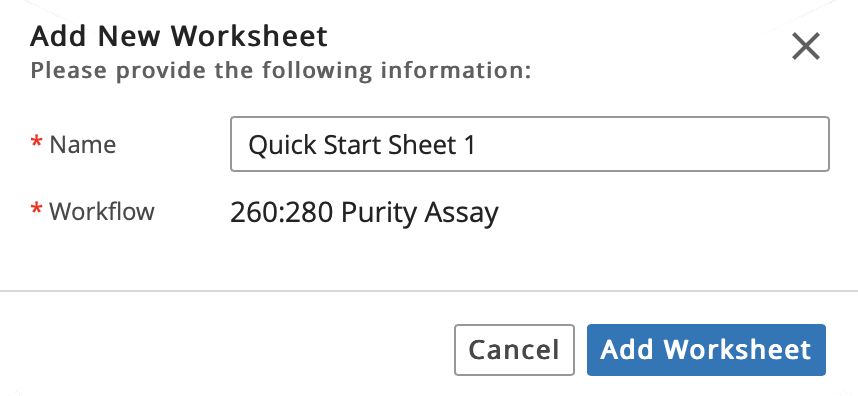
Open the LIMS app. Click the icon (shown below) that is located to the right of Hello Quick Start (4). This will open the Add New Worksheet dialog.

Observe that the Name and Workflow fields are already populated. Update the Name to "Quick Start Sheet 1". Confirm that "260:280 Purity Assay" is selected as the Workflow. Click Add Worksheet.
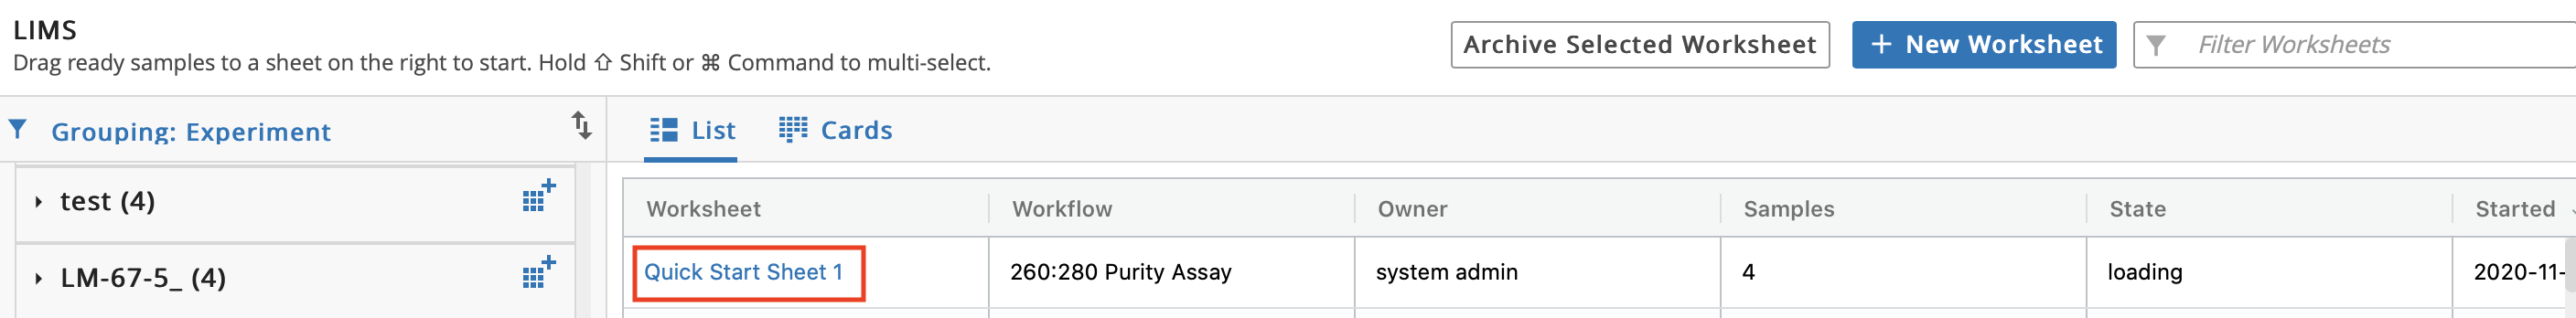
To view the Worksheet, click the Quick Start Sheet 1 link.
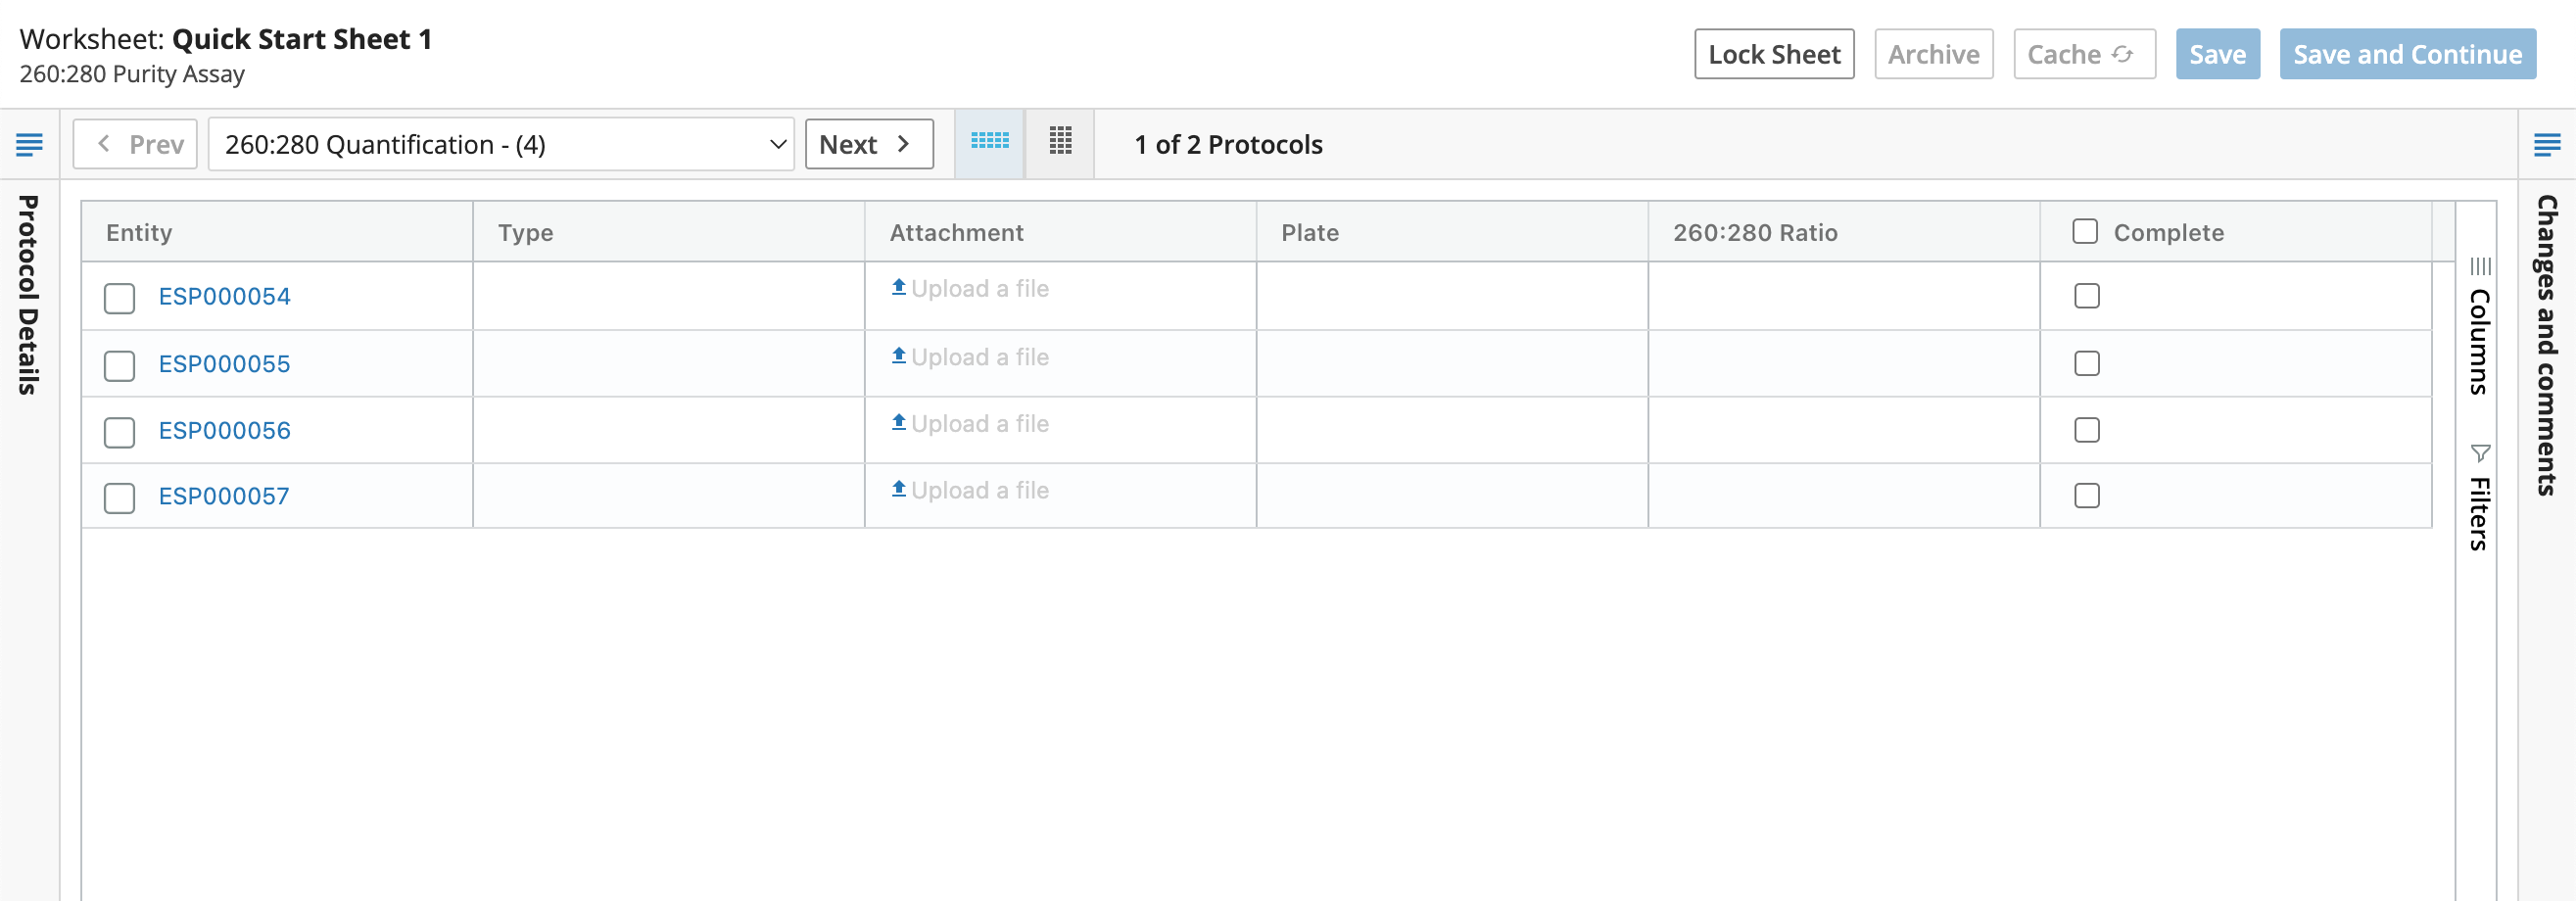
8.12. Process Entities and Perform Data Entry
In this section you will practice processing Entities by performing data entry in the Worksheet you just created.
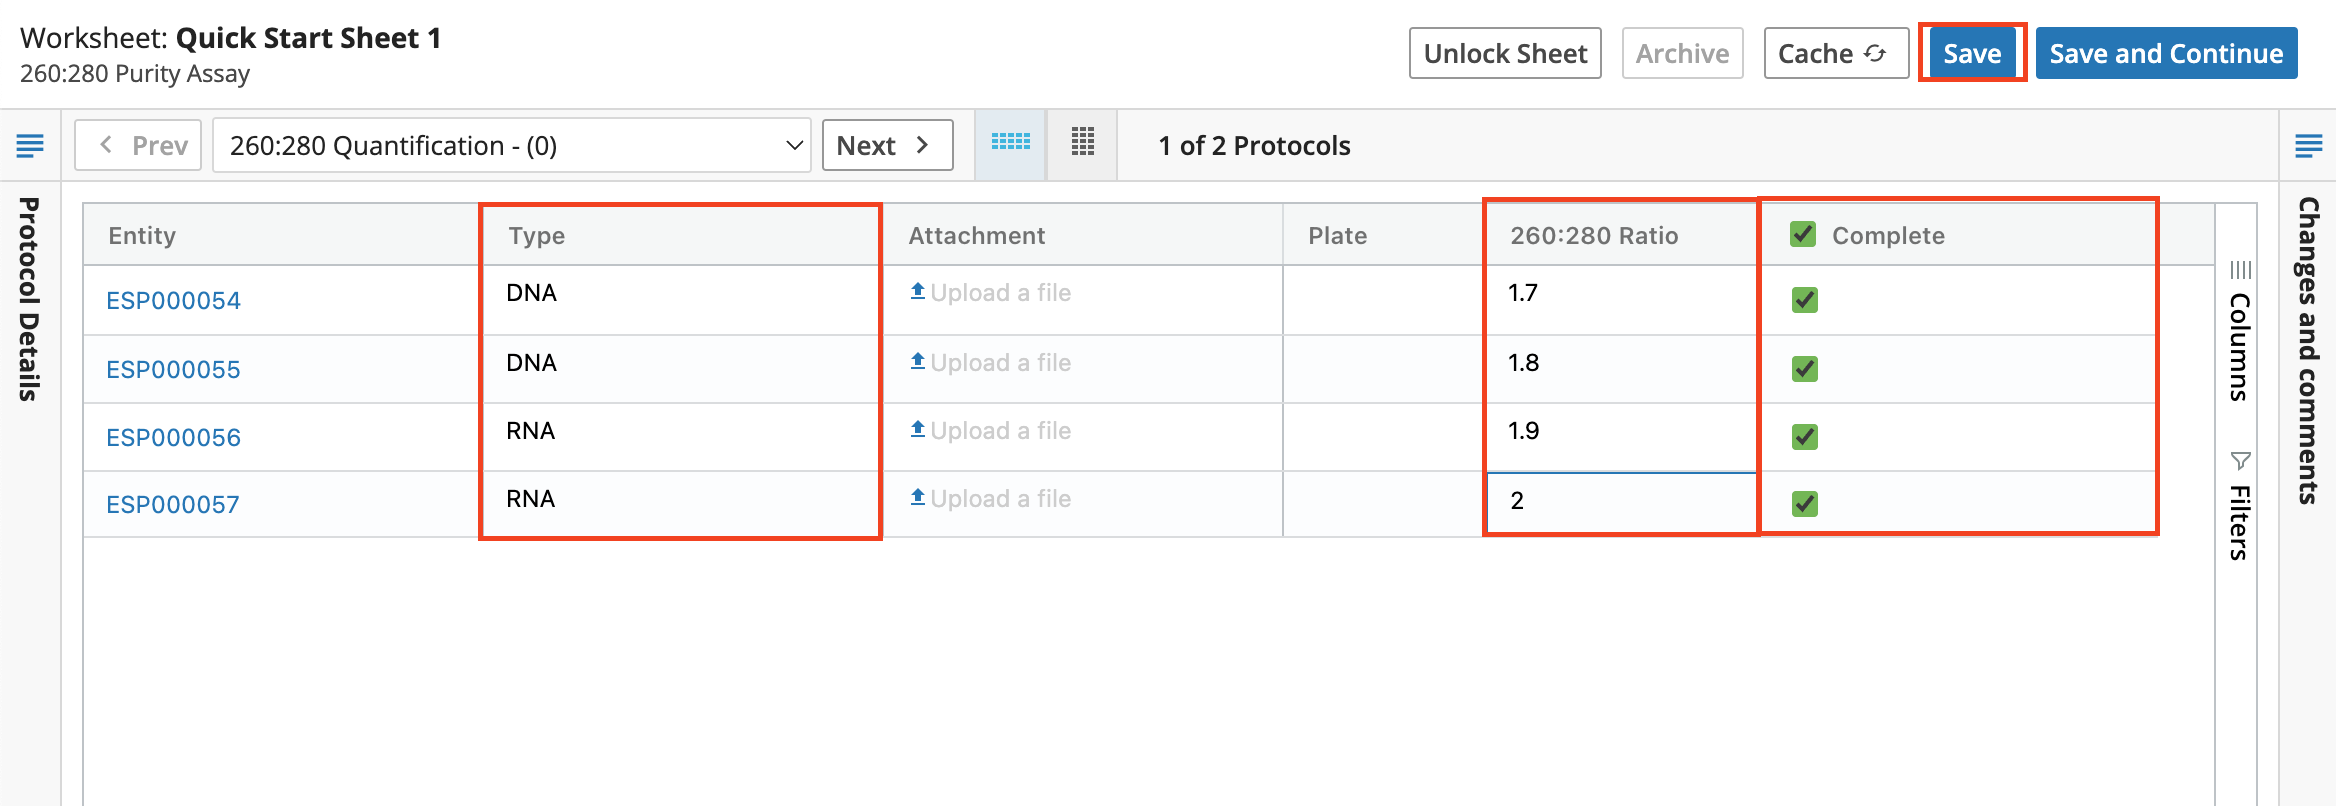
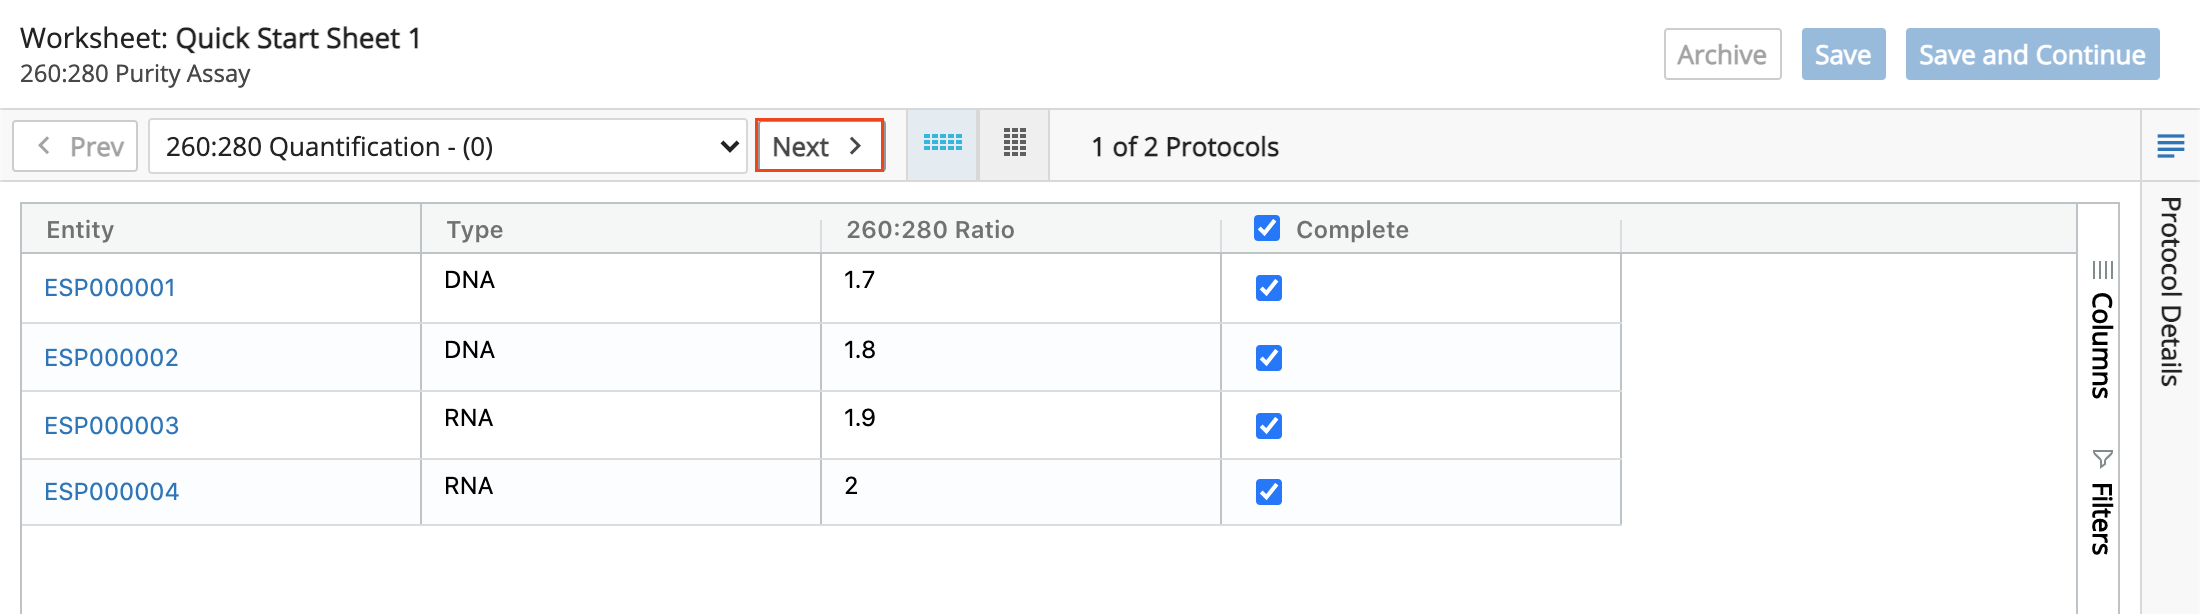
In the Type column, select "DNA," "DNA," "RNA," and "RNA" from the drop-down list as shown below.
In the 260:280 Ratio column, enter the values "1.7," "1.8," "1.9," and "2.0."
Select the "Complete" checkbox for each Entity.
Click Save.
Hint
Be sure to Save Worksheets as they are completed. L7|ESP stores the history of all Worksheet data, but clicking Save is necessary to ensure data goes into the system.
Important
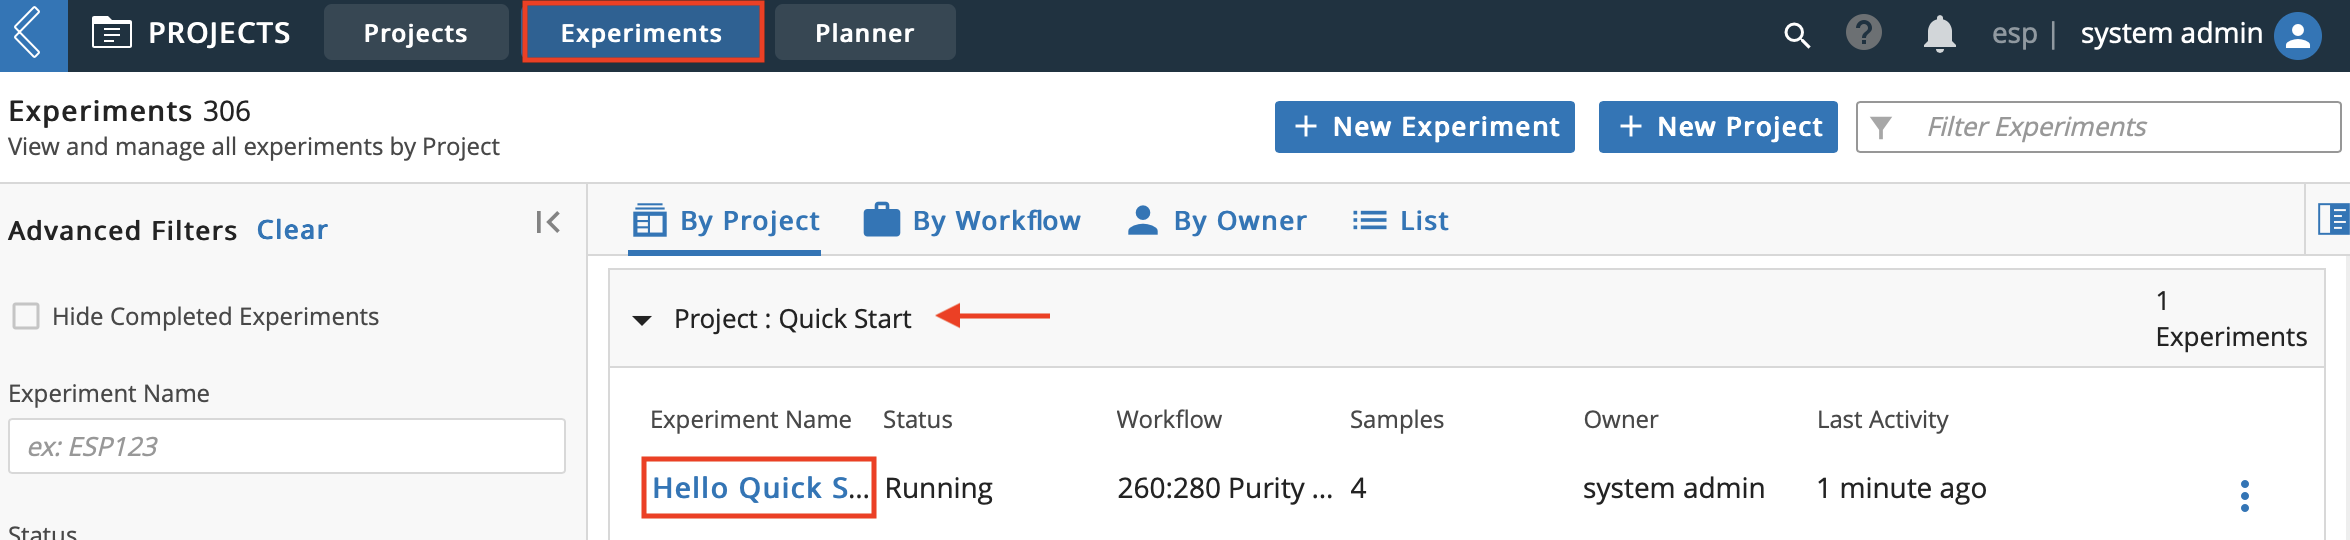
To understand how the Entities are moving through the Experiment, open a new browser window and open the Projects app. Click the Experiments tab. Click the Hello Quick Start link under the Quick Start Project.
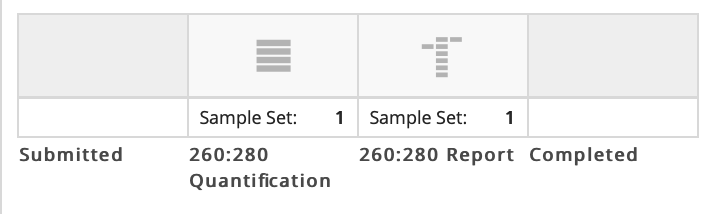
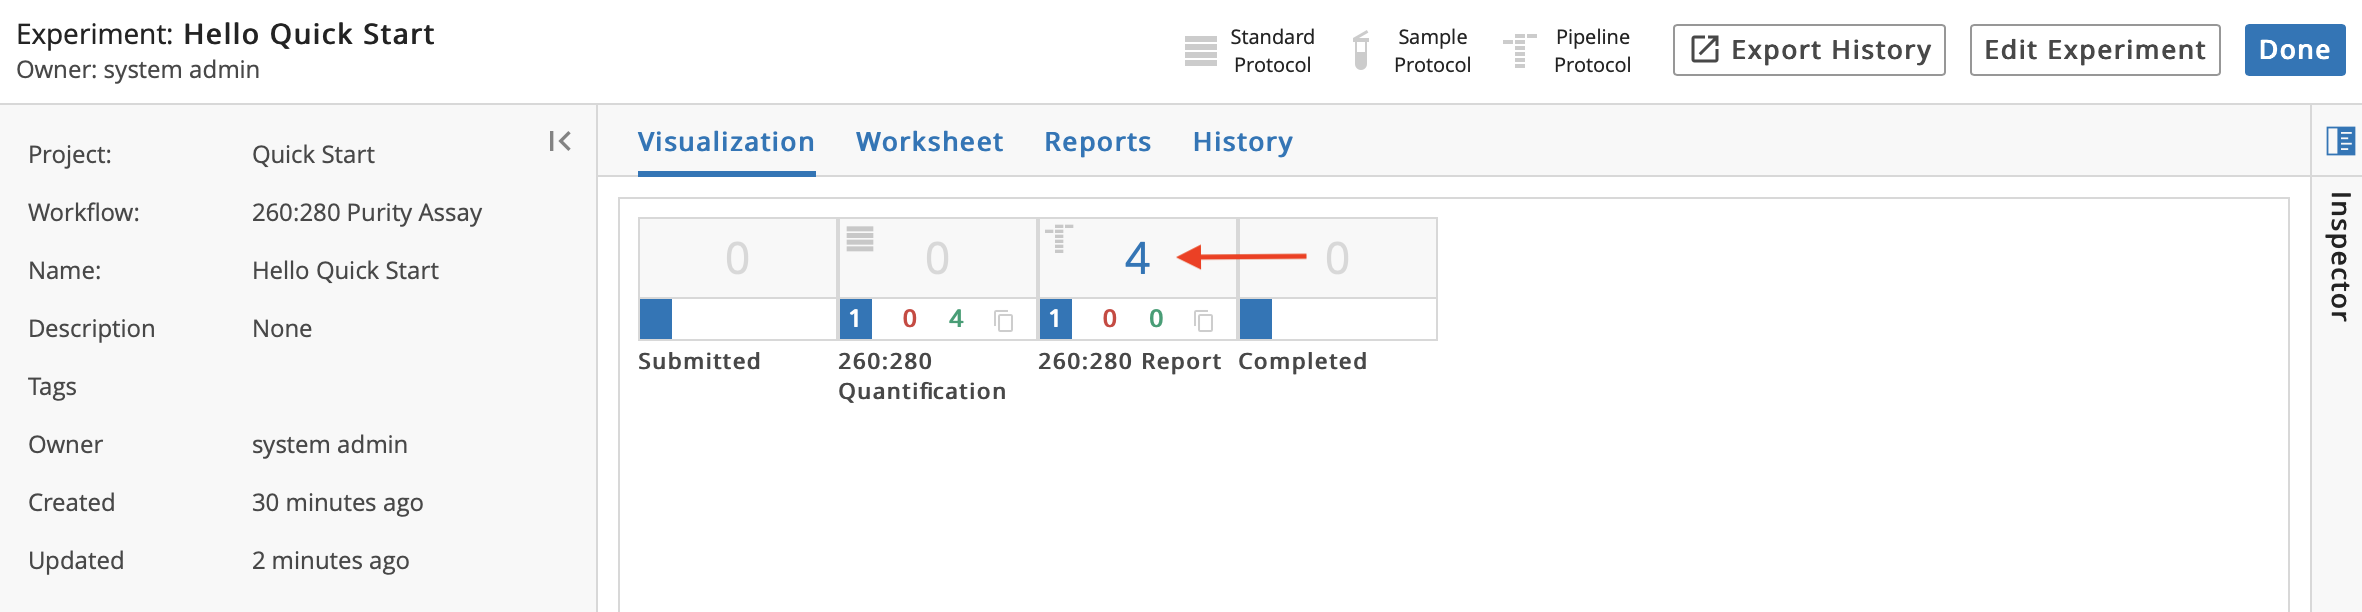
The blue 4 above 260:280 Report indicates that the 4 Entities you completed in the 260:280 Quantification Protocol have advanced to the 260:280 Report Protocol.
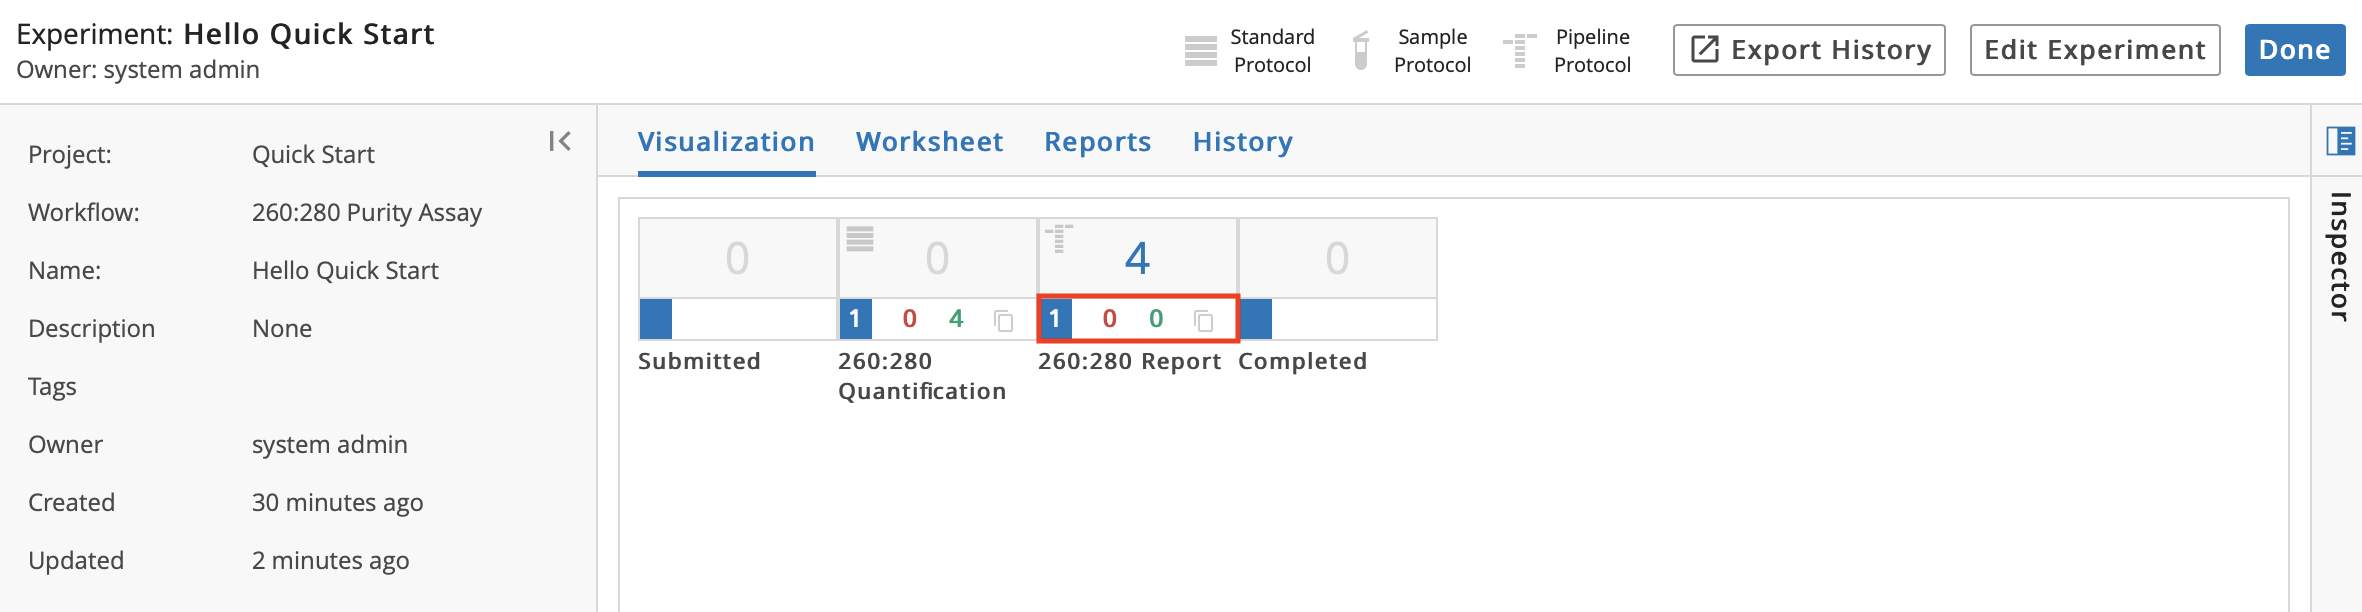
The white 1 in a blue box indicates 1 Entity set. The red 0 indicates that 0 Entities failed the 260:280 Quantification Protocol. The green 4 indicates that 4 Entities passed the 260:280 Quantification Protocol.
Return to the browser window with the LIMS app.
Click Next to enter information for the next Protocol.
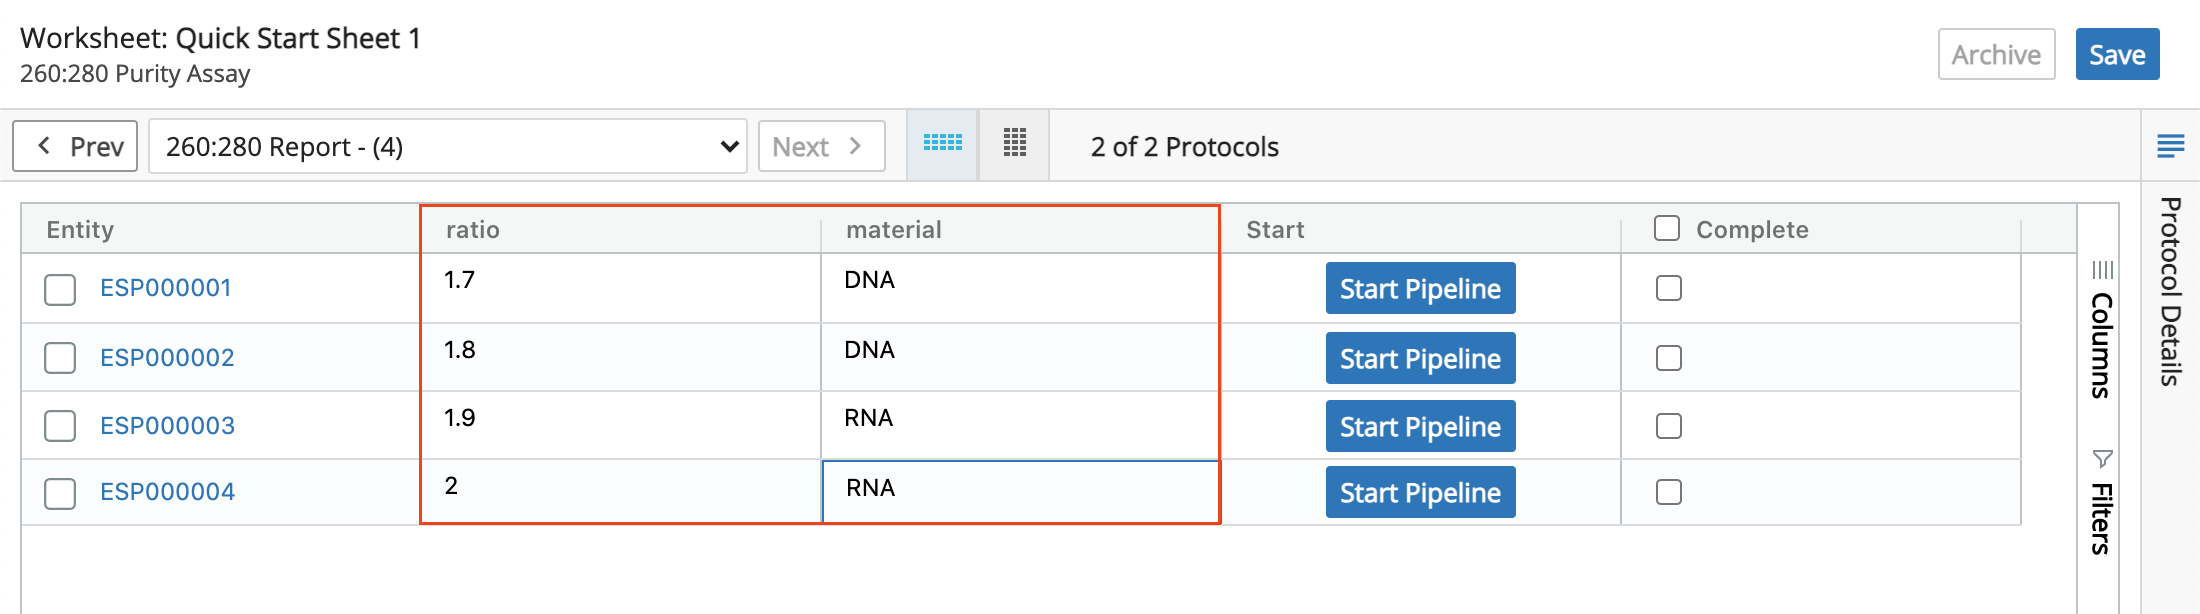
In the Material column, select "DNA," "DNA," "RNA," and "RNA" from the drop-down list.
In the Ratio column, enter "1.7," "1.8," "1.9," and "2.0."
Click Save.
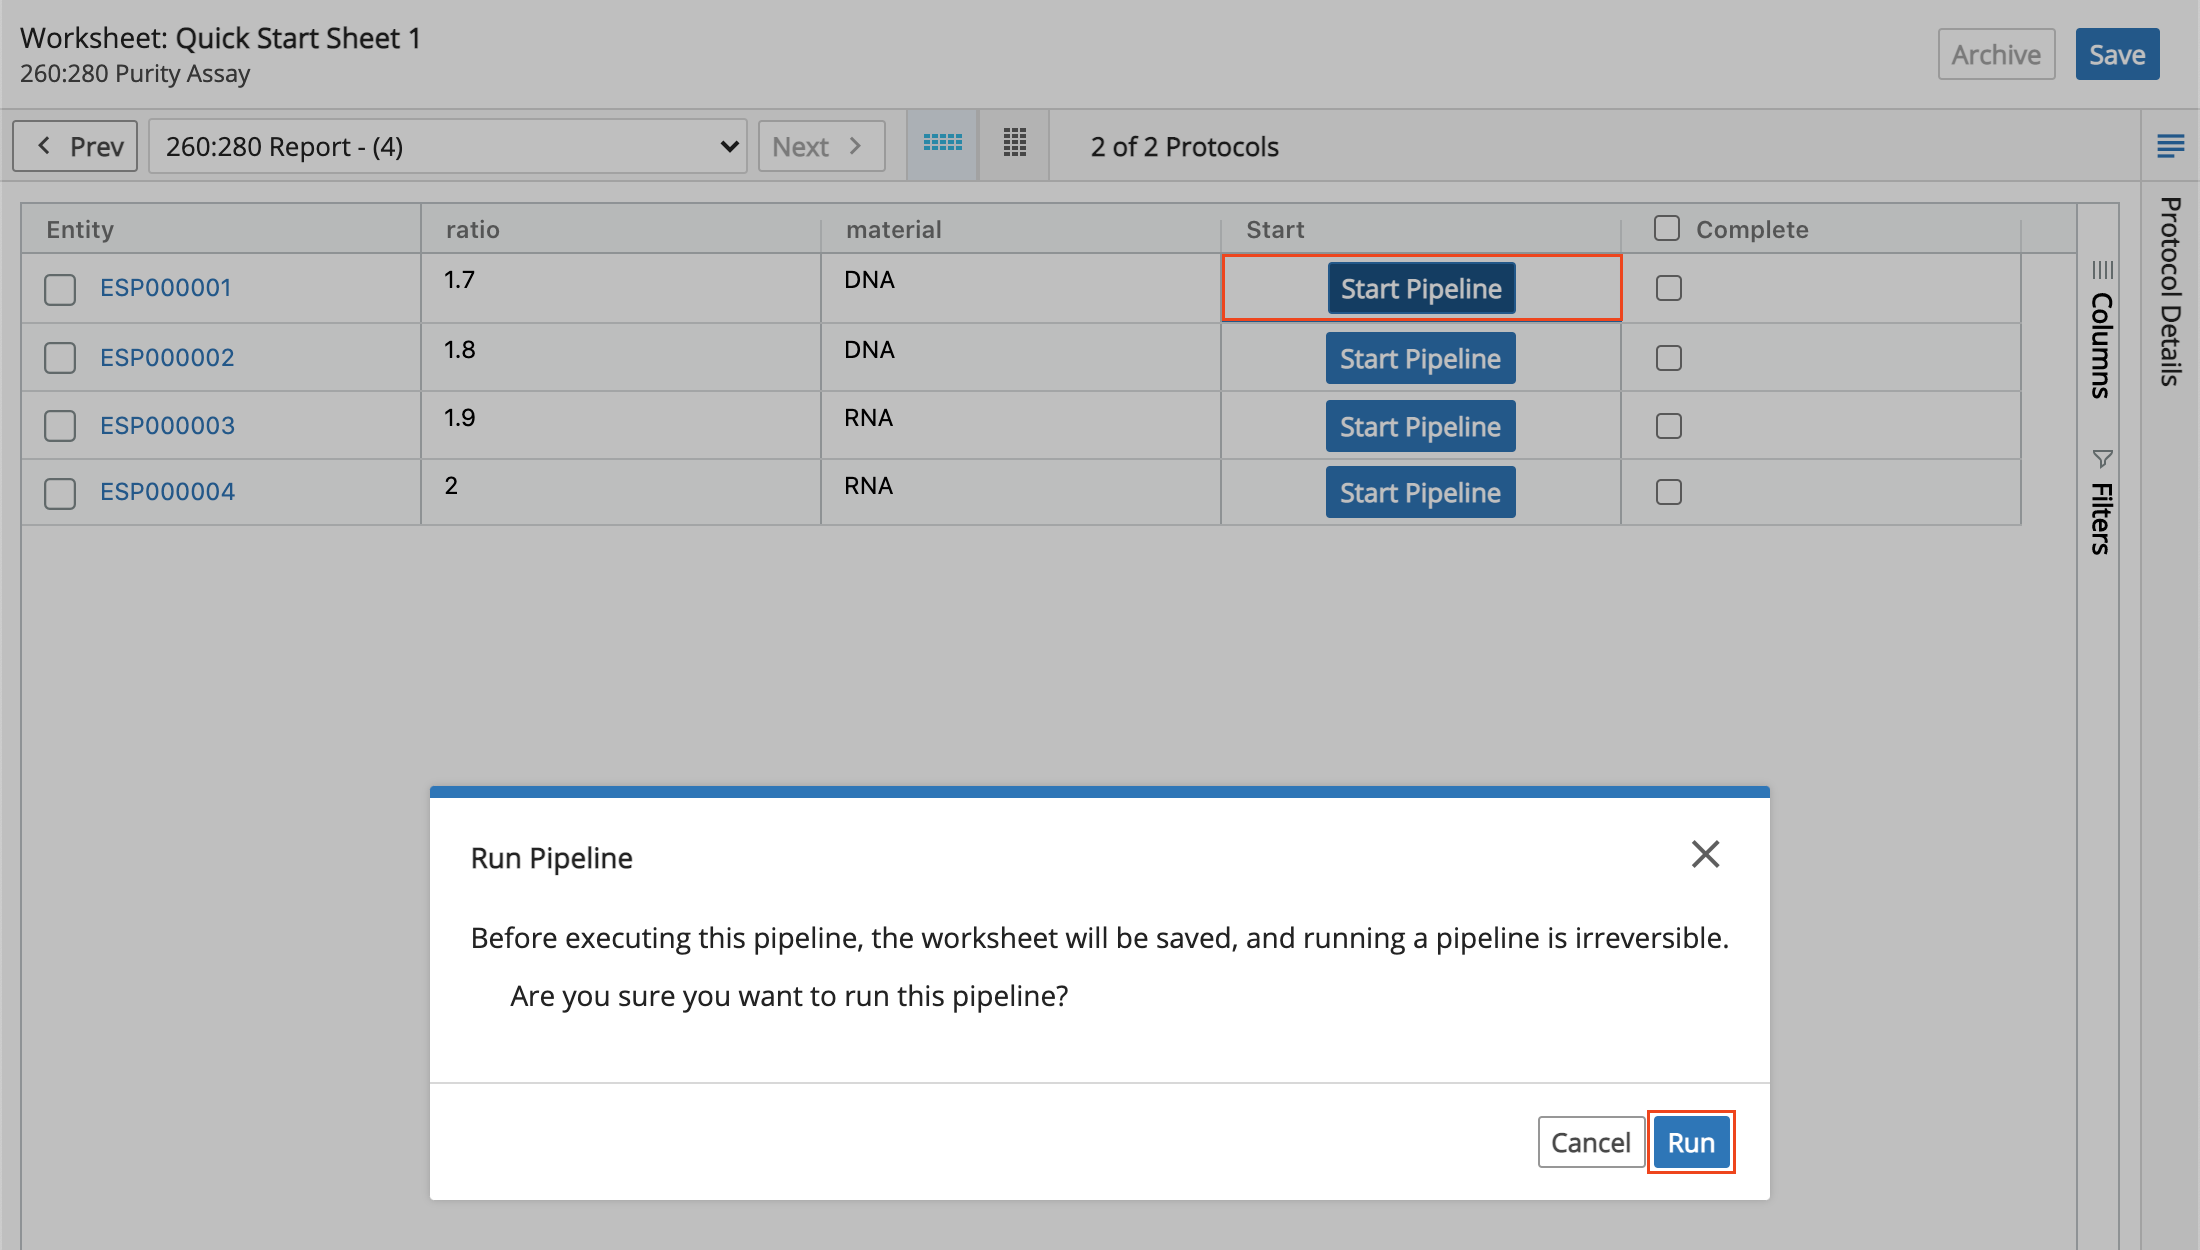
For the first Entity, click Start Pipeline to run the Pipeline that generates the Report. Click Run in the Run Pipeline verification dialog.
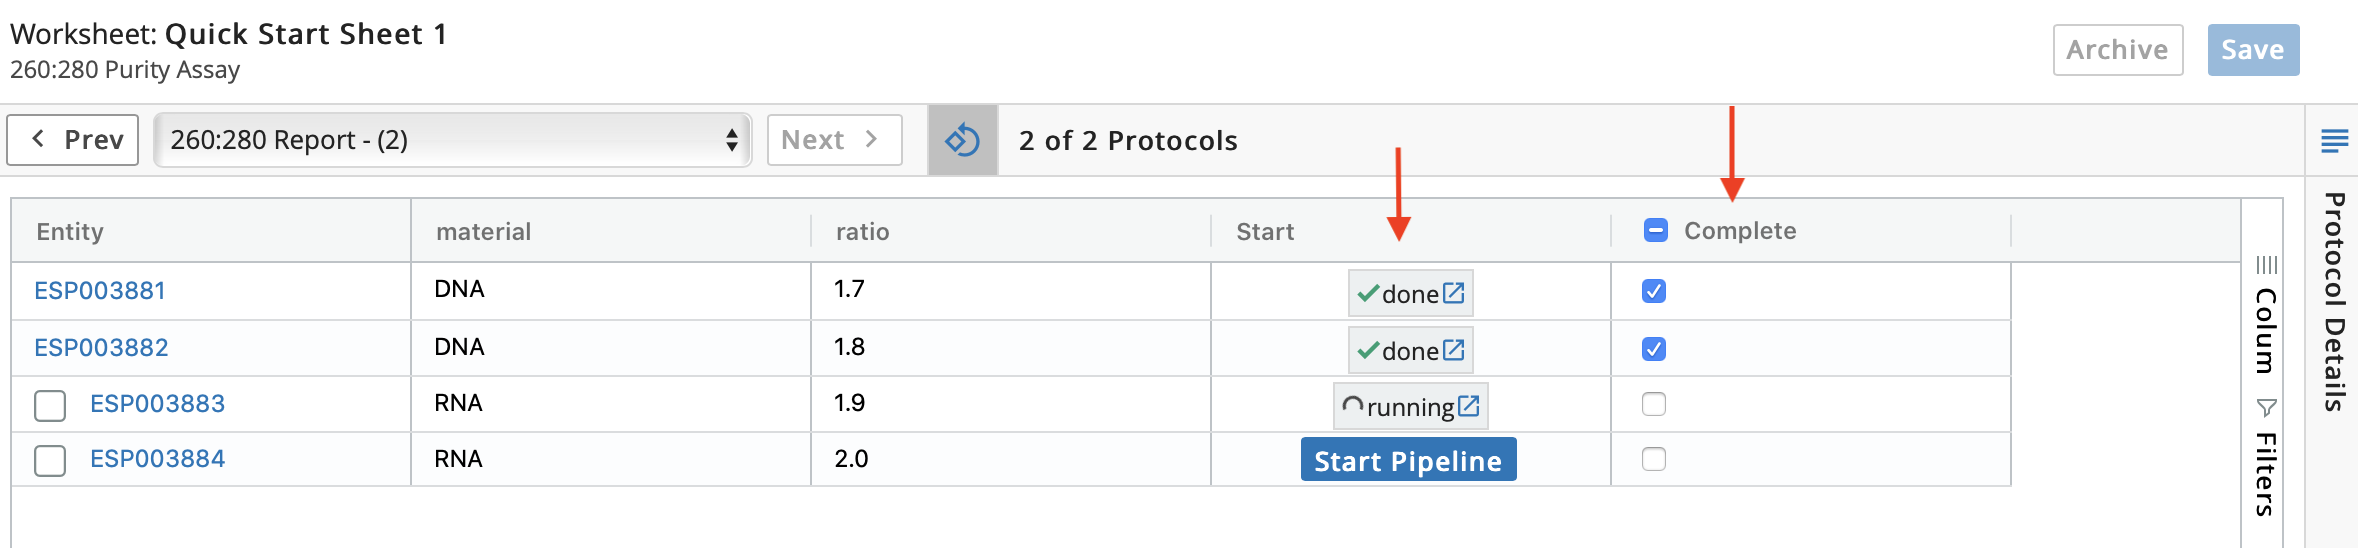
Entities can run simultaneously so click Start Pipeline and then Run in the Run Pipeline verification dialog for each of the remaining Entities. All Complete checkboxes will be checked and the Start column will say Done once the Pipelines are finished running.
Important
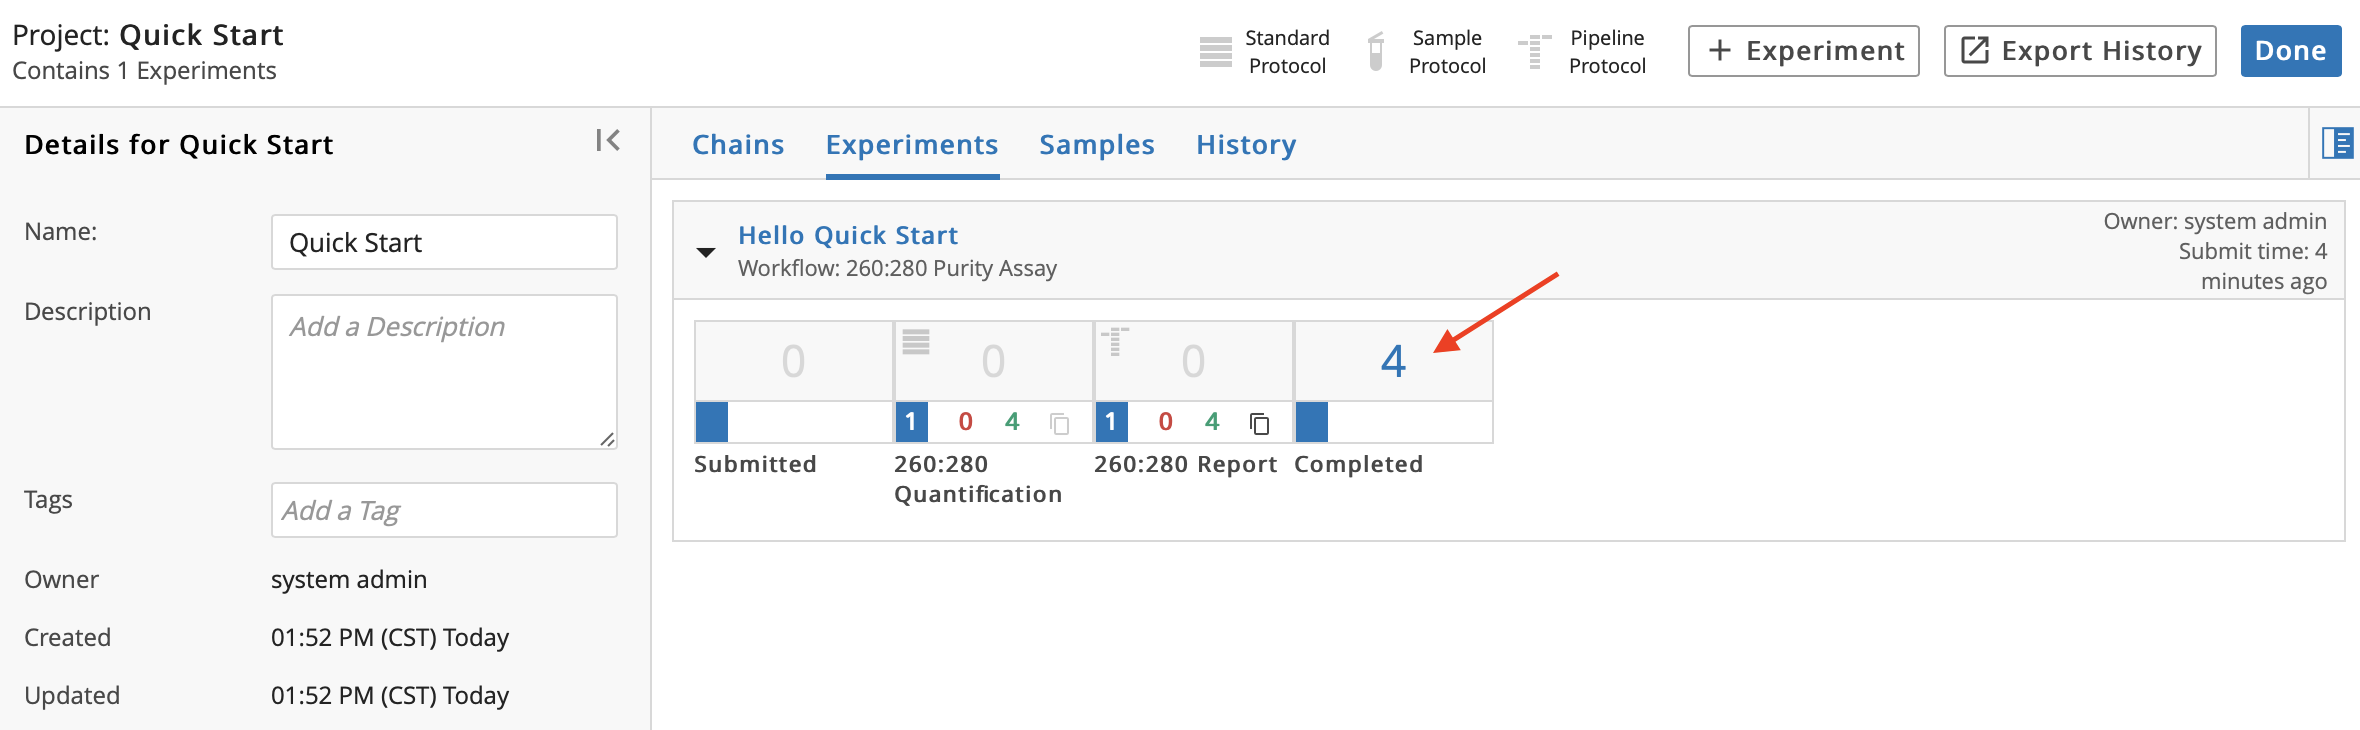
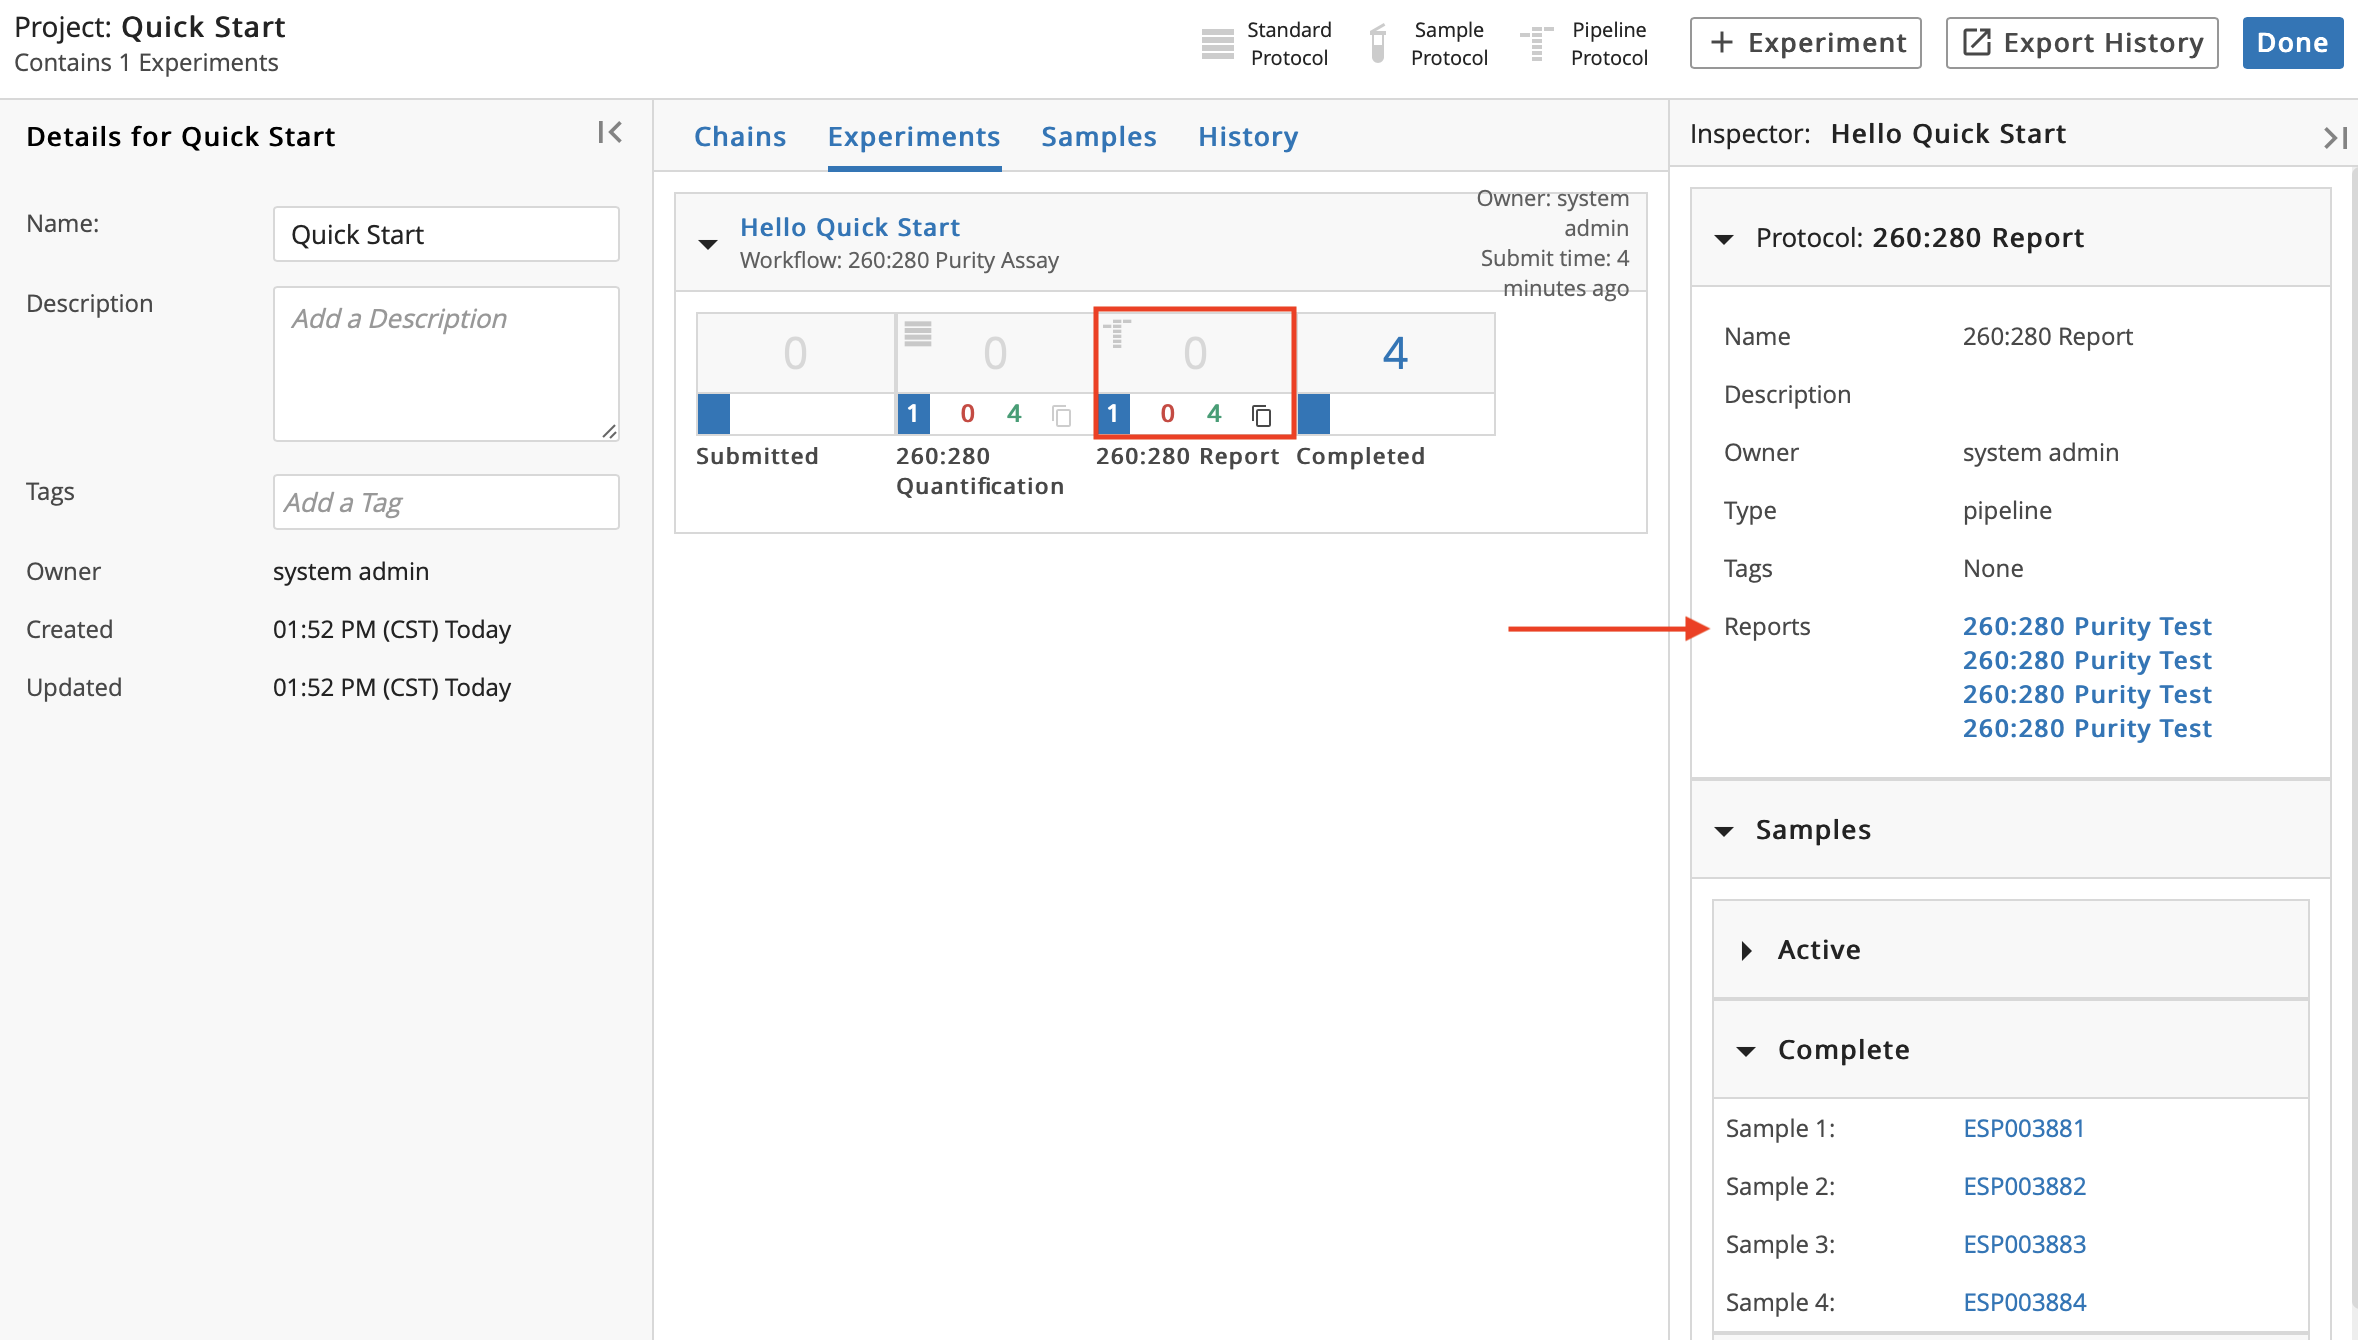
To monitor Entities as they move through an Experiment, open the Projects app. Click View Details on the the Quick Start Project. Observe that the 4 Entities have advanced to the Completed stage.
Click on the Protocol box for the 260:280 Report. Observe that the Reports are directly accessible from the Inspector. The Reports are also accessible from the Entities page.
8.13. Link Data between Protocols
Note
For both Protocols in the Worksheet, you manually entered the same material type information and 260:280 Ratio values. Entering the same information more than one time creates an opportunity for data inconsistency - L7|ESP provides you with the tools to eliminate such a risk. Values can be passed between Protocols in a Workflow using Data Links. Through Data Linking, columns in a Protocol are populated with information/values from a Protocol that occurs beforehand in the same Workflow.
In this section you will update the Workflow to automatically populate the Pipeline Protocol with the information/values that get entered in the Standard Protocol.
Open the L7|Master app. Click Workflows from the Processes menu.
Click the 260:280 Purity Assay Workflow.

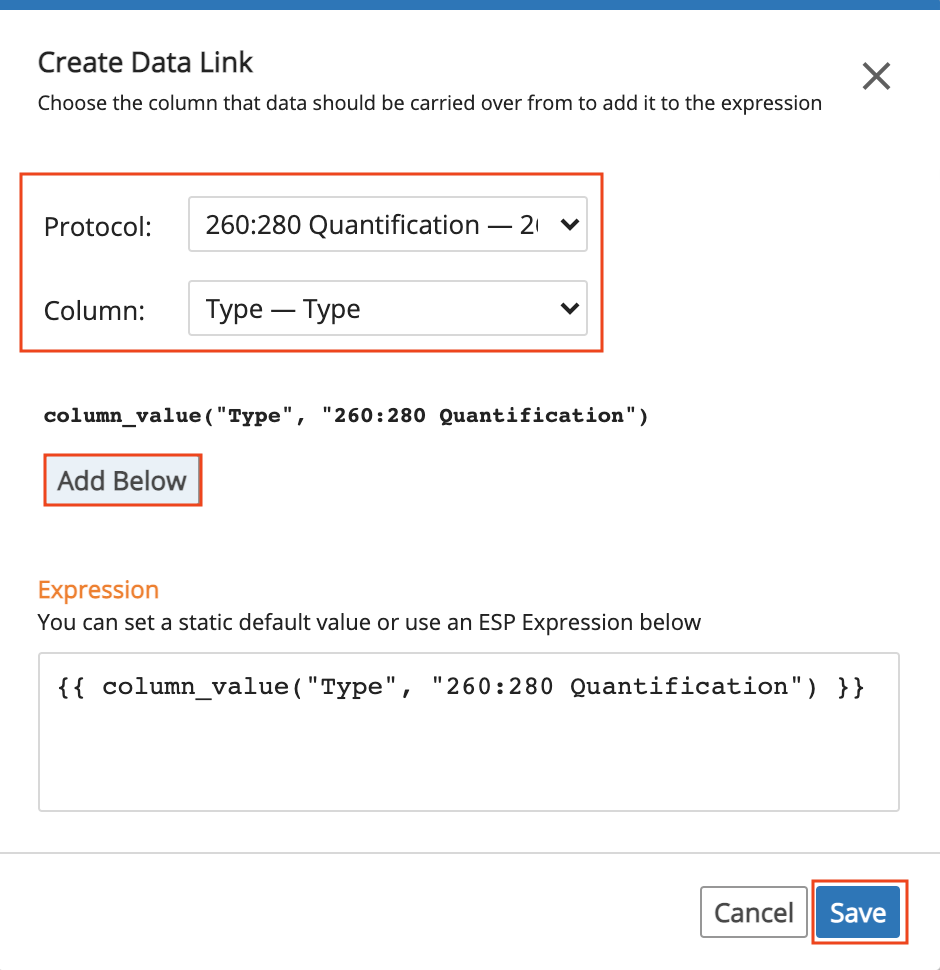
Click the 260:280 Report Protocol box. On the material row, click + Create to create a Data Link to connect the values in this Protocol to the values entered in the 260:280 Quantification Protocol.

In the Create Data Link dialog, select 260:280 Quantification as the Protocol. Select Type as the Column (the selected column is where the data will be linked). Click Add Below to generate an L7|ESP Expression based on the Protocol and Column selected. Click Save.
Hint
Note that the L7|ESP Expression Language previously used to create parameters when setting up the Pipeline can also be used in other parts of L7|ESP. In this case, you can set the value of the
materialfield to be an Expression that references a value in another Protocol.
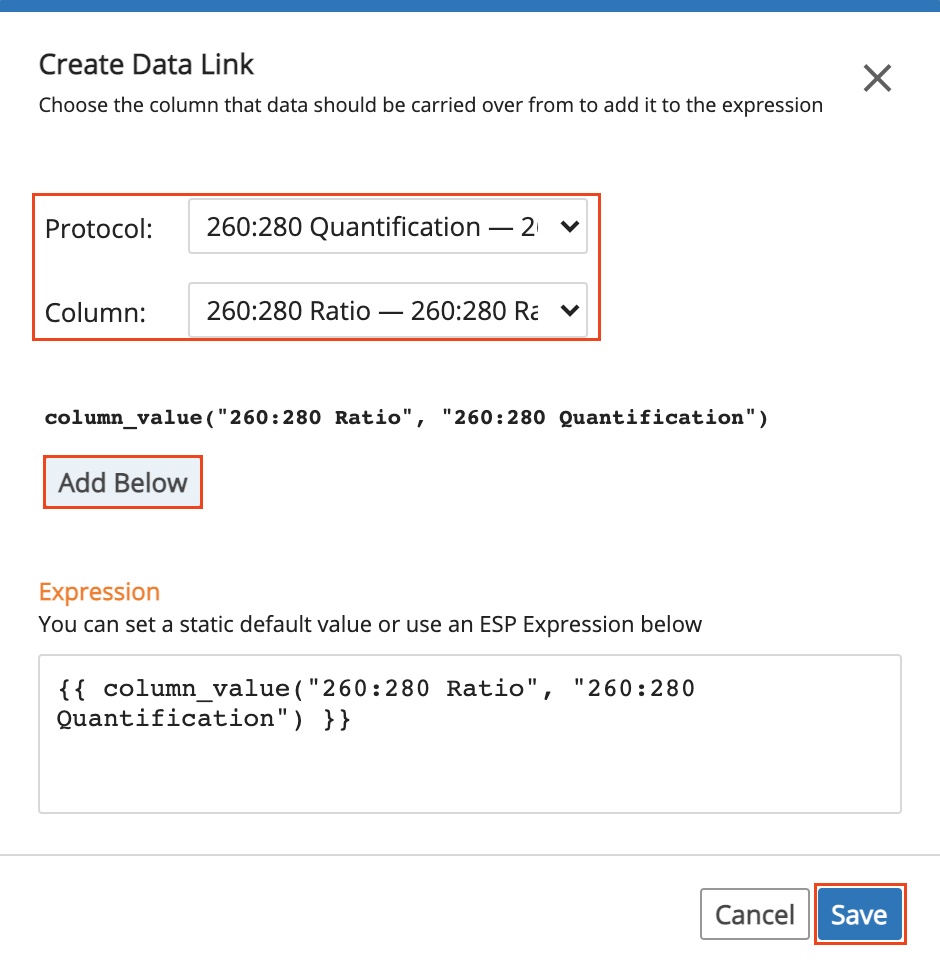
On the ratio bar, click Create.

In the Create Data Link dialog, select 260:280 Quantification as the Protocol. Select 260:280 Ratio as the Column. Click Add Below. Click Save.
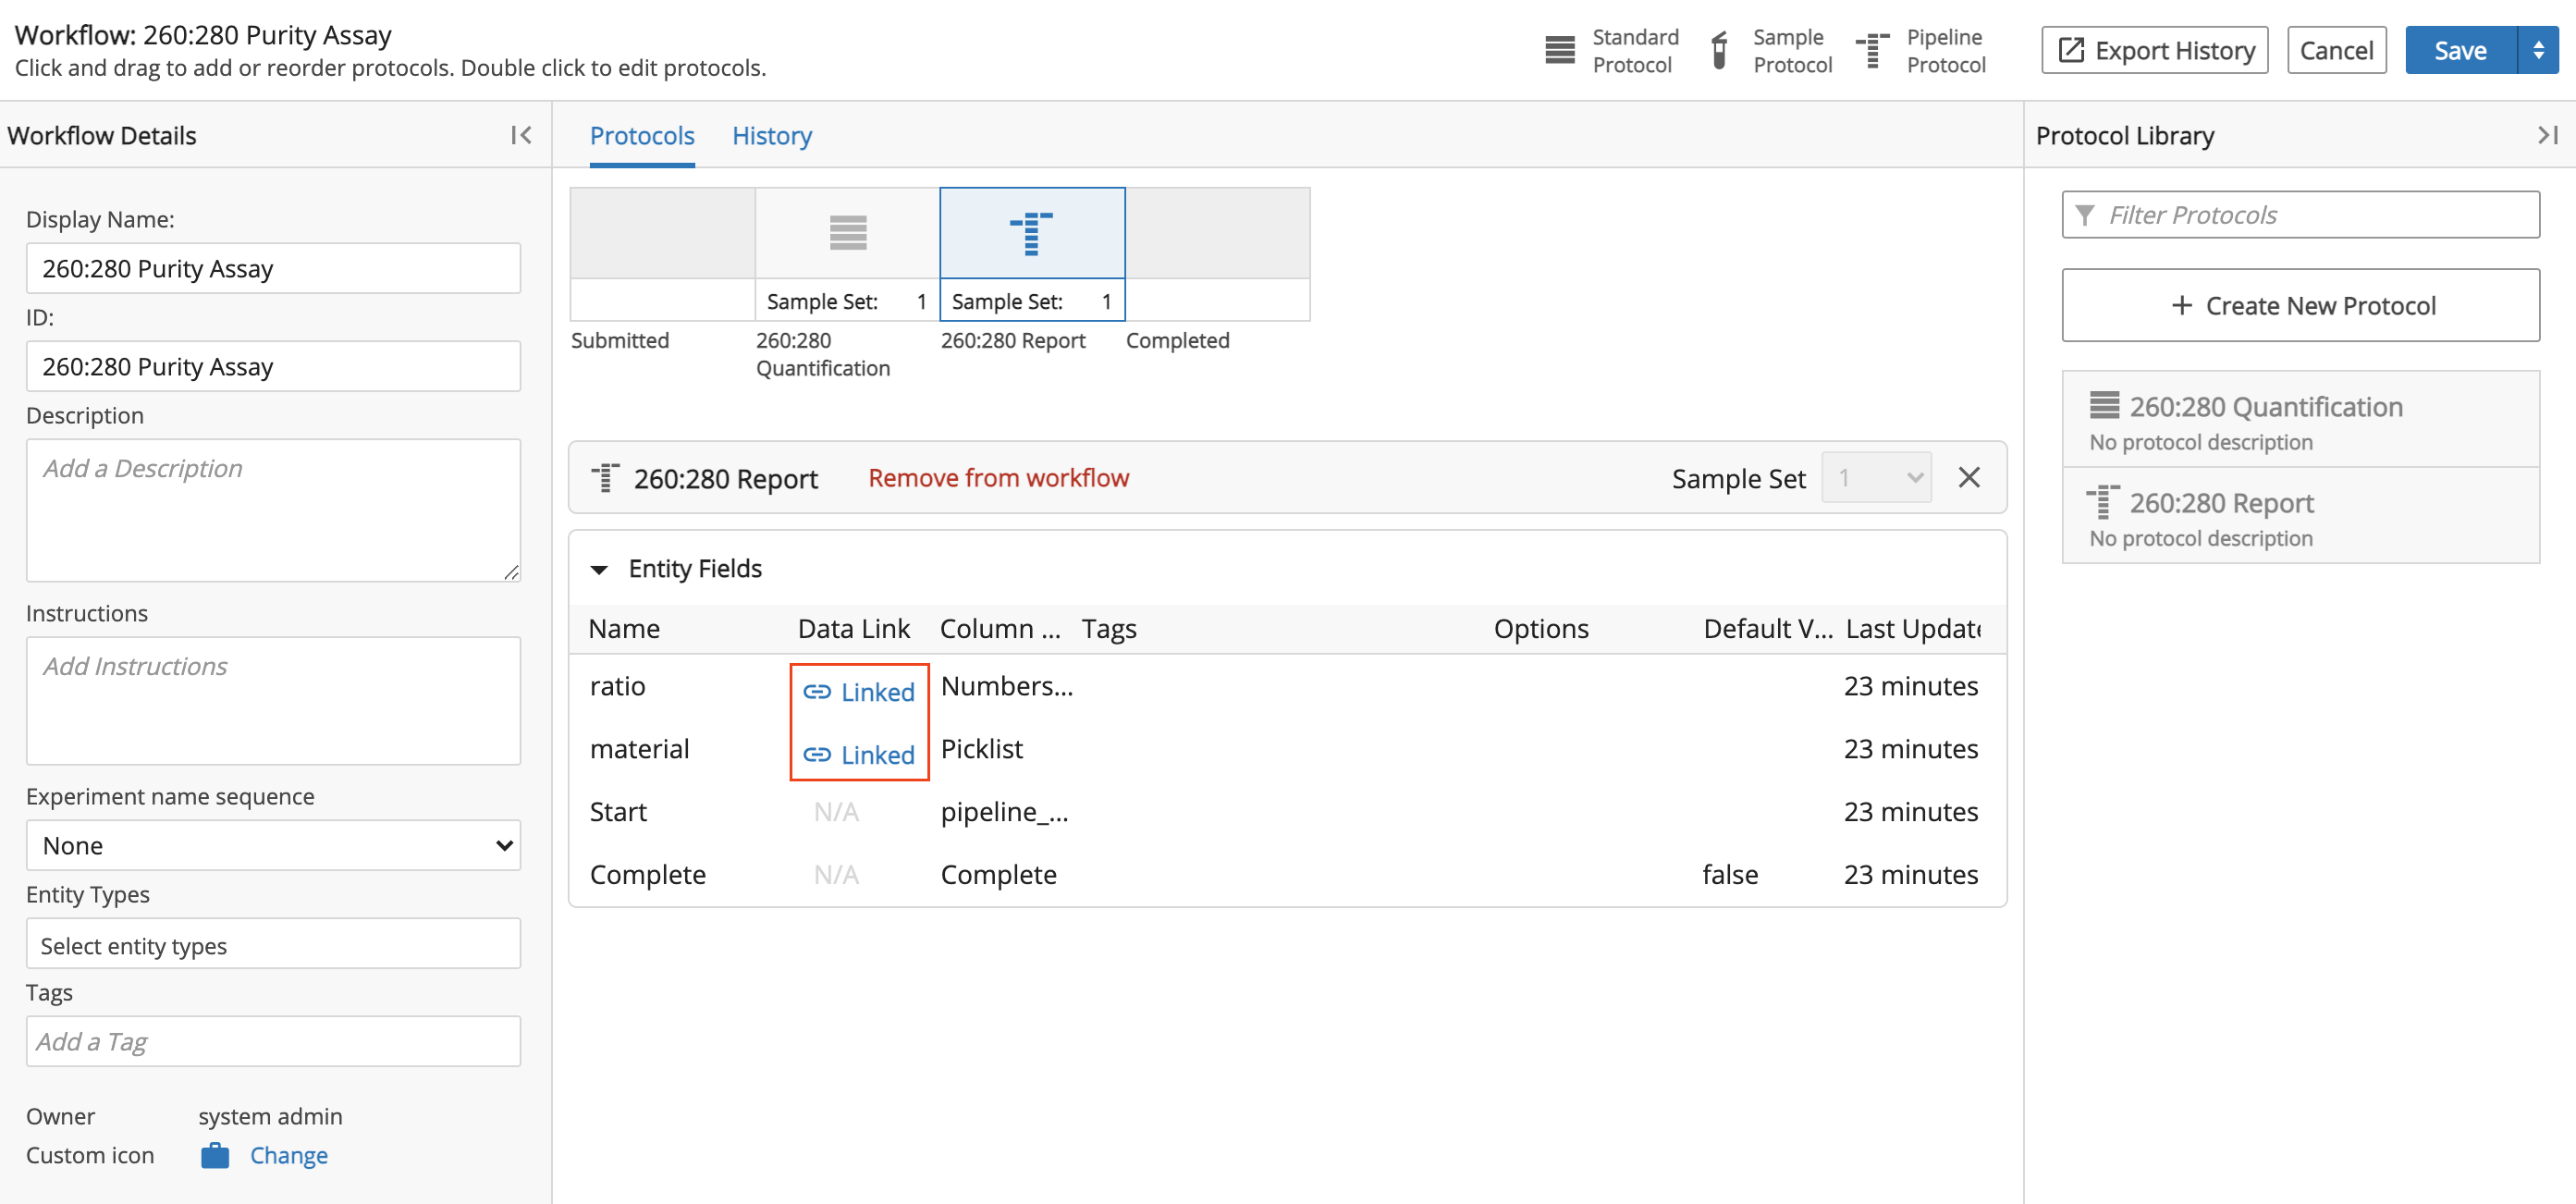
Observe that the Data Link now displays 2 Data Links. Click Save to save the updated Workflow.
By following this Quick Start Guide, you have successfully created an Entity-to-answer laboratory Workflow for the purity quality control test.
8.14. Test Updated Workflow
To test your new L7|ESP knowledge and skills (as well as the Data Links), perform the steps below to test the updated Workflow.
Create a new Experiment under the Quick Start Project as follows:
Select the 260:280 Purity Assay Workflow.
Name the Experiment "Linked Quick Start."
When adding Entities, choose the Use Existing Entities option and check 3 random Entities.
Submit the 3 Entities.
Create a Worksheet for the Experiment named "Quick Start Sheet 2".
"Process" the 3 Entities and perform data entry as follows:
Open the Quick Start Sheet 2 Worksheet.
Complete the 260:280 Quantification Protocol by filling out the Type column and the 260:280 Ratio Column.
Complete the 3 Entities to advance them to the next Protocol (i.e., 260:280 Report Protocol). Observe that the material and ratio columns are prepopulated with the data from the 260:280 Quantification Protocol. This demonstrates that the data links are working.
Run the 3 Pipelines to complete the Experiment.
Click Save.
View the results of the Experiment.